Question: EXCHANGE ASSIGNMENT B, PART 1: M&M CANDY CONTROL Purchase: five individual serving packages of plain M&M milk chocolate candies, such as those available from a
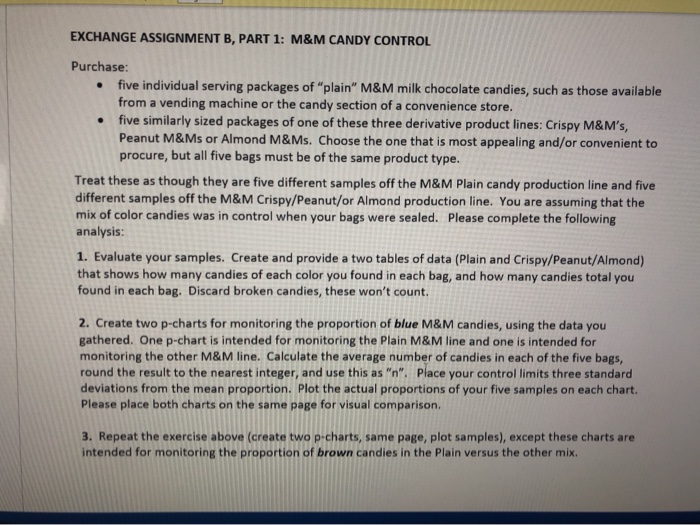
EXCHANGE ASSIGNMENT B, PART 1: M&M CANDY CONTROL Purchase: five individual serving packages of "plain" M&M milk chocolate candies, such as those available from a vending machine or the candy section of a convenience store. five similarly sized packages of one of these three derivative product lines: Crispy M&M's, Peanut M&Ms or Almond M&Ms. Choose the one that is most appealing and/or convenient to procure, but all five bags must be of the same product type. Treat these as though they are five different samples off the M&M Plain candy production line and five different samples off the M&M Crispy/Peanut/or Almond production line. You are assuming that the mix of color candies was in control when your bags were sealed. Please complete the following analysis: 1. Evaluate your samples. Create and provide a two tables of data (Plain and Crispy/Peanut/Almond) that shows how many candies of each color you found in each bag, and how many candies total you found in each bag. Discard broken candies, these won't count. 2. Create two p-charts for monitoring the proportion of blue M&M candies, using the data you gathered. One p-chart is intended for monitoring the Plain M&M line and one is intended for monitoring the other M&M line. Calculate the average number of candies in each of the five bags, round the result to the nearest integer, and use this as "n". Place your control limits three standard deviations from the mean proportion. Plot the actual proportions of your five samples on each chart. Please place both charts on the same page for visual comparison 3. Repeat the exercise above (create two p-charts, same page, plot samples), except these charts are intended for monitoring the proportion of brown candies in the Plain versus the other mix. EXCHANGE ASSIGNMENT B, PART 1: M&M CANDY CONTROL Purchase: five individual serving packages of "plain" M&M milk chocolate candies, such as those available from a vending machine or the candy section of a convenience store. five similarly sized packages of one of these three derivative product lines: Crispy M&M's, Peanut M&Ms or Almond M&Ms. Choose the one that is most appealing and/or convenient to procure, but all five bags must be of the same product type. Treat these as though they are five different samples off the M&M Plain candy production line and five different samples off the M&M Crispy/Peanut/or Almond production line. You are assuming that the mix of color candies was in control when your bags were sealed. Please complete the following analysis: 1. Evaluate your samples. Create and provide a two tables of data (Plain and Crispy/Peanut/Almond) that shows how many candies of each color you found in each bag, and how many candies total you found in each bag. Discard broken candies, these won't count. 2. Create two p-charts for monitoring the proportion of blue M&M candies, using the data you gathered. One p-chart is intended for monitoring the Plain M&M line and one is intended for monitoring the other M&M line. Calculate the average number of candies in each of the five bags, round the result to the nearest integer, and use this as "n". Place your control limits three standard deviations from the mean proportion. Plot the actual proportions of your five samples on each chart. Please place both charts on the same page for visual comparison 3. Repeat the exercise above (create two p-charts, same page, plot samples), except these charts are intended for monitoring the proportion of brown candies in the Plain versus the other mix