

Question: exclude a, b and c 5.2. Consider a resource-allocation problem having the following data: Resource Usage per Unit of Each Activity Resource 1 2 Amount
exclude a, b and c
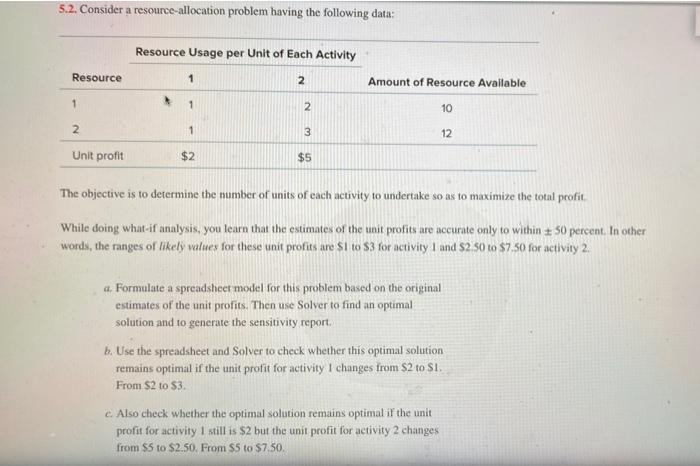
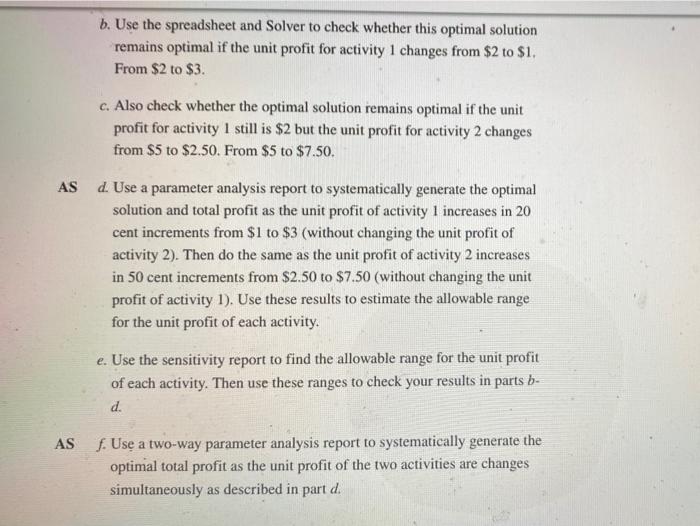
5.2. Consider a resource-allocation problem having the following data: Resource Usage per Unit of Each Activity Resource 1 2 Amount of Resource Available 1 1 2 10 2 1 3 12 Unit profit $2 $5 The objective is to determine the number of units of each activity to undertake so as to maximize the total profit. While doing what if analysis, you learn that the estimates of the unit profits are accurate only to within + 50 percent. In other words, the ranges of likely values for these unit profits are $1 to $3 for activity and $2 50 to $7.50 for activity 2. a. Formulate a spreadsheet model for this problem based on the original estimates of the unit profits. Then use Solver to find an optimal solution and to generate the sensitivity report, b. Use the spreadsheet and Solver to check whether this optimal solution remains optimal if the unit profit for activity I changes from $2 to SI. From $2 to $3. c. Also check whether the optimal solution remains optimal if the unit profit for activity I still is $2 but the unit profit for activity 2 changes from $5 to $2.50. From $5 to $7.50. b. Use the spreadsheet and Solver to check whether this optimal solution remains optimal if the unit profit for activity 1 changes from $2 to $1. From $2 to $3. c. Also check whether the optimal solution remains optimal if the unit profit for activity I still is $2 but the unit profit for activity 2 changes from $5 to $2.50. From $5 to $7.50. AS d. Use a parameter analysis report to systematically generate the optimal solution and total profit as the unit profit of activity 1 increases in 20 cent increments from $1 to $3 (without changing the unit profit of activity 2). Then do the same as the unit profit of activity 2 increases in 50 cent increments from $2.50 to $7.50 (without changing the unit profit of activity 1). Use these results to estimate the allowable range for the unit profit of each activity. e. Use the sensitivity report to find the allowable range for the unit profit of each activity. Then use these ranges to check your results in parts b- d. AS f. Use a two-way parameter analysis report to systematically generate the optimal total profit as the unit profit of the two activities are changes simultaneously as described in part d Step by Step Solution
There are 3 Steps involved in it
1 Expert Approved Answer
Step: 1 Unlock

Question Has Been Solved by an Expert!
Get step-by-step solutions from verified subject matter experts
Step: 2 Unlock
Step: 3 Unlock