

Question: Exercise 0 1 : Define the function f = y 2 - x 3 + x Use the ezplot command to plot the function f
Exercise :
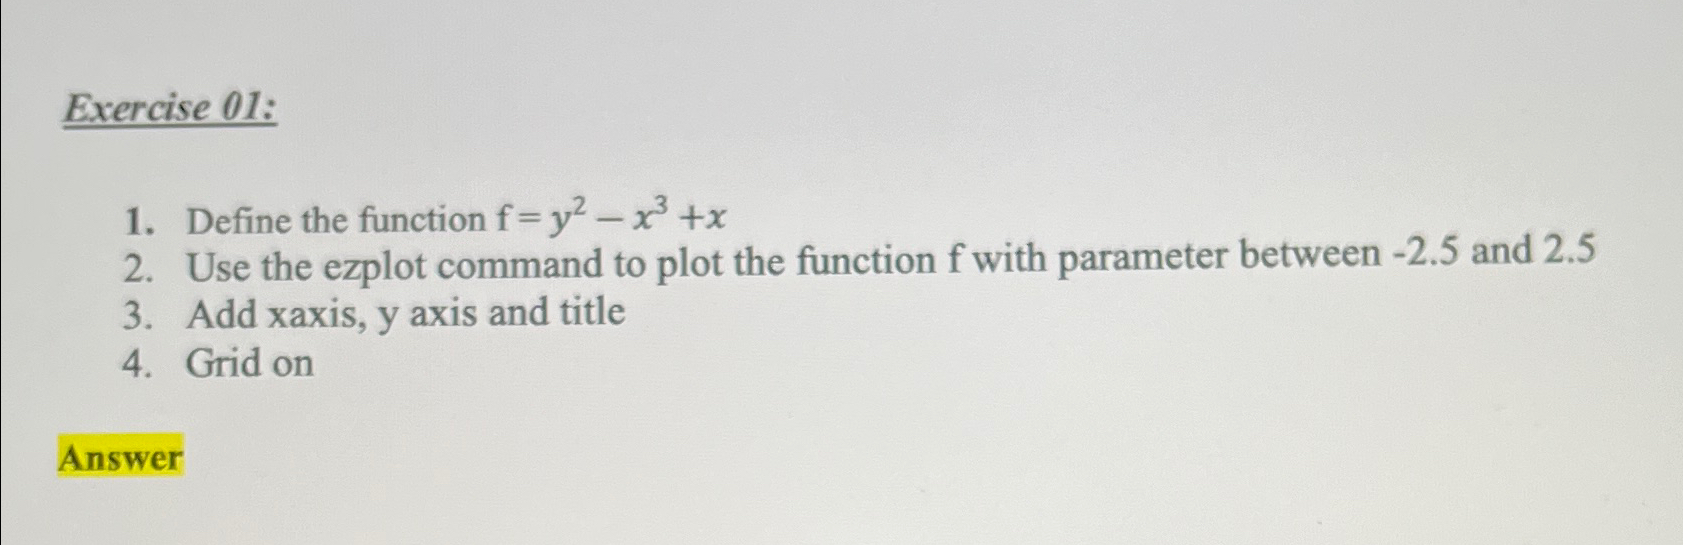
Define the function
Use the ezplot command to plot the function with parameter between and
Add xaxis, axis and title
Grid on
If someone could help me write this code using MatLab I would appreciate it
Step by Step Solution
There are 3 Steps involved in it
1 Expert Approved Answer
Step: 1 Unlock

Question Has Been Solved by an Expert!
Get step-by-step solutions from verified subject matter experts
Step: 2 Unlock
Step: 3 Unlock