

Question: Exercise 1 0 . 1 Background: This exercise further explores the principle about data and complex systems discussed in this chapter: Graphs reveal interesting structures
Exercise Background: This exercise further explores the principle about data and complex systems discussed in this chapter: Graphs reveal interesting structures present in the dataWheeler Objective: To evaluate graphic presentations of data and select the one that provides the most valuable feedback about the systems behavior. Instructions: As the manager of an ED you are faced with the challenge of improving flow and better matching your staffing plan to patient demand. Like the mammography center manager in this chapter, your monthly reports from the finance department present the EDs volume statistics in a spreadsheet according to this month, last month, year to date, and the same month in the previous year. You decide to graph the data. You experiment and come up with the following three graphs using the same information. Select the graph that provides you with the most insight and explain why you chose that graph.
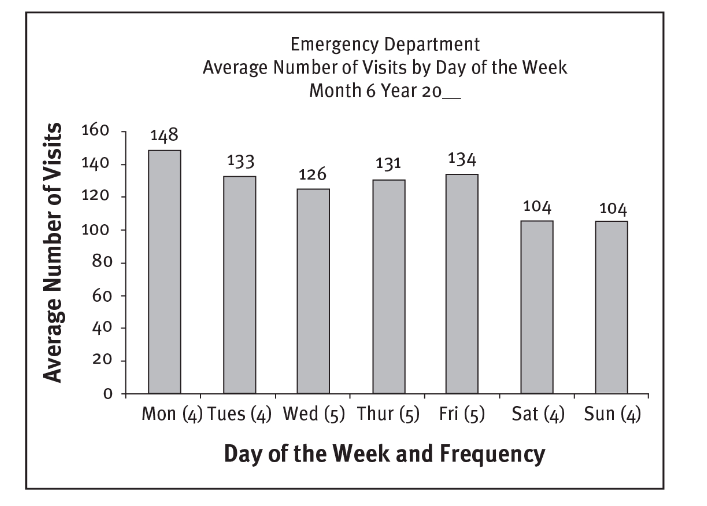
Emergency Department
Average Number of Visits by Day of the WeekEmergency Department
Average Number of Visits by Day of the Week
Month Year Emergency Department
Average Number of Visits by Day of the Week
Month Year
Month Year
Step by Step Solution
There are 3 Steps involved in it
1 Expert Approved Answer
Step: 1 Unlock

Question Has Been Solved by an Expert!
Get step-by-step solutions from verified subject matter experts
Step: 2 Unlock
Step: 3 Unlock