

Question: Exercise 1: 1. (4 pts, 1 pt each part) Image I/O, quantification and display. Consider the image mri axial.tif. (a) Load the image into the
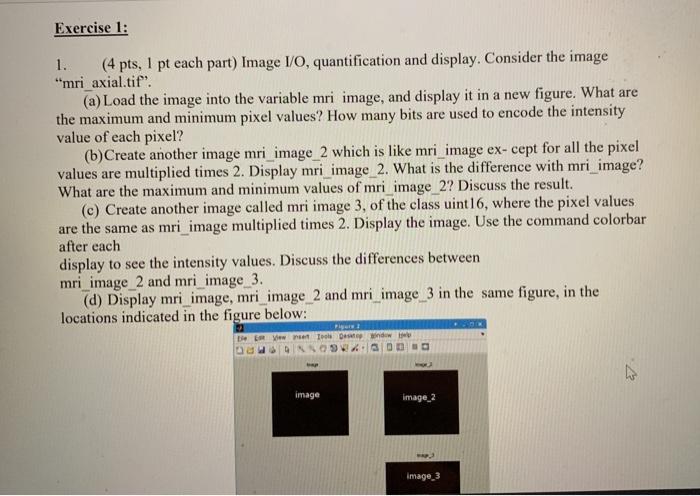

Exercise 1: 1. (4 pts, 1 pt each part) Image I/O, quantification and display. Consider the image "mri axial.tif". (a) Load the image into the variable mri image, and display it in a new figure. What are the maximum and minimum pixel values? How many bits are used to encode the intensity value of each pixel? (b)Create another image mri_image_2 which is like mri_image ex-cept for all the pixel values are multiplied times 2. Display mri_image_2. What is the difference with mri_image? What are the maximum and minimum values of mri_image_2? Discuss the result. (c) Create another image called mri image 3, of the class uint16, where the pixel values are the same as mri_image multiplied times 2. Display the image. Use the command colorbar after each display to see the intensity values. Discuss the differences between mri_image_2 and mri_image_3. (d) Display mri_image, mri image_2 and mri_image_3 in the same figure, in the locations indicated in the figure below: Pie De w To Deew N image image_2 Image 3 Useful MATLAB functions: imread, class, eye, imshow, subplot 2. (4 pts, 1 pt each) Image indexing. Consider the image "mri axial.tif" from the previous exercise. Load it into the variable mri_image. Exercise 1: 1. (4 pts, 1 pt each part) Image I/O, quantification and display. Consider the image "mri axial.tif". (a) Load the image into the variable mri image, and display it in a new figure. What are the maximum and minimum pixel values? How many bits are used to encode the intensity value of each pixel? (b)Create another image mri_image_2 which is like mri_image ex-cept for all the pixel values are multiplied times 2. Display mri_image_2. What is the difference with mri_image? What are the maximum and minimum values of mri_image_2? Discuss the result. (c) Create another image called mri image 3, of the class uint16, where the pixel values are the same as mri_image multiplied times 2. Display the image. Use the command colorbar after each display to see the intensity values. Discuss the differences between mri_image_2 and mri_image_3. (d) Display mri_image, mri image_2 and mri_image_3 in the same figure, in the locations indicated in the figure below: Pie De w To Deew N image image_2 Image 3 Useful MATLAB functions: imread, class, eye, imshow, subplot 2. (4 pts, 1 pt each) Image indexing. Consider the image "mri axial.tif" from the previous exercise. Load it into the variable mri_image
Step by Step Solution
There are 3 Steps involved in it

Get step-by-step solutions from verified subject matter experts