

Question: Exercise 1 This exercise will help you understand the Lorenz curve. 1. Complete column 3 in Table 18.1 using the data from column 2. Then
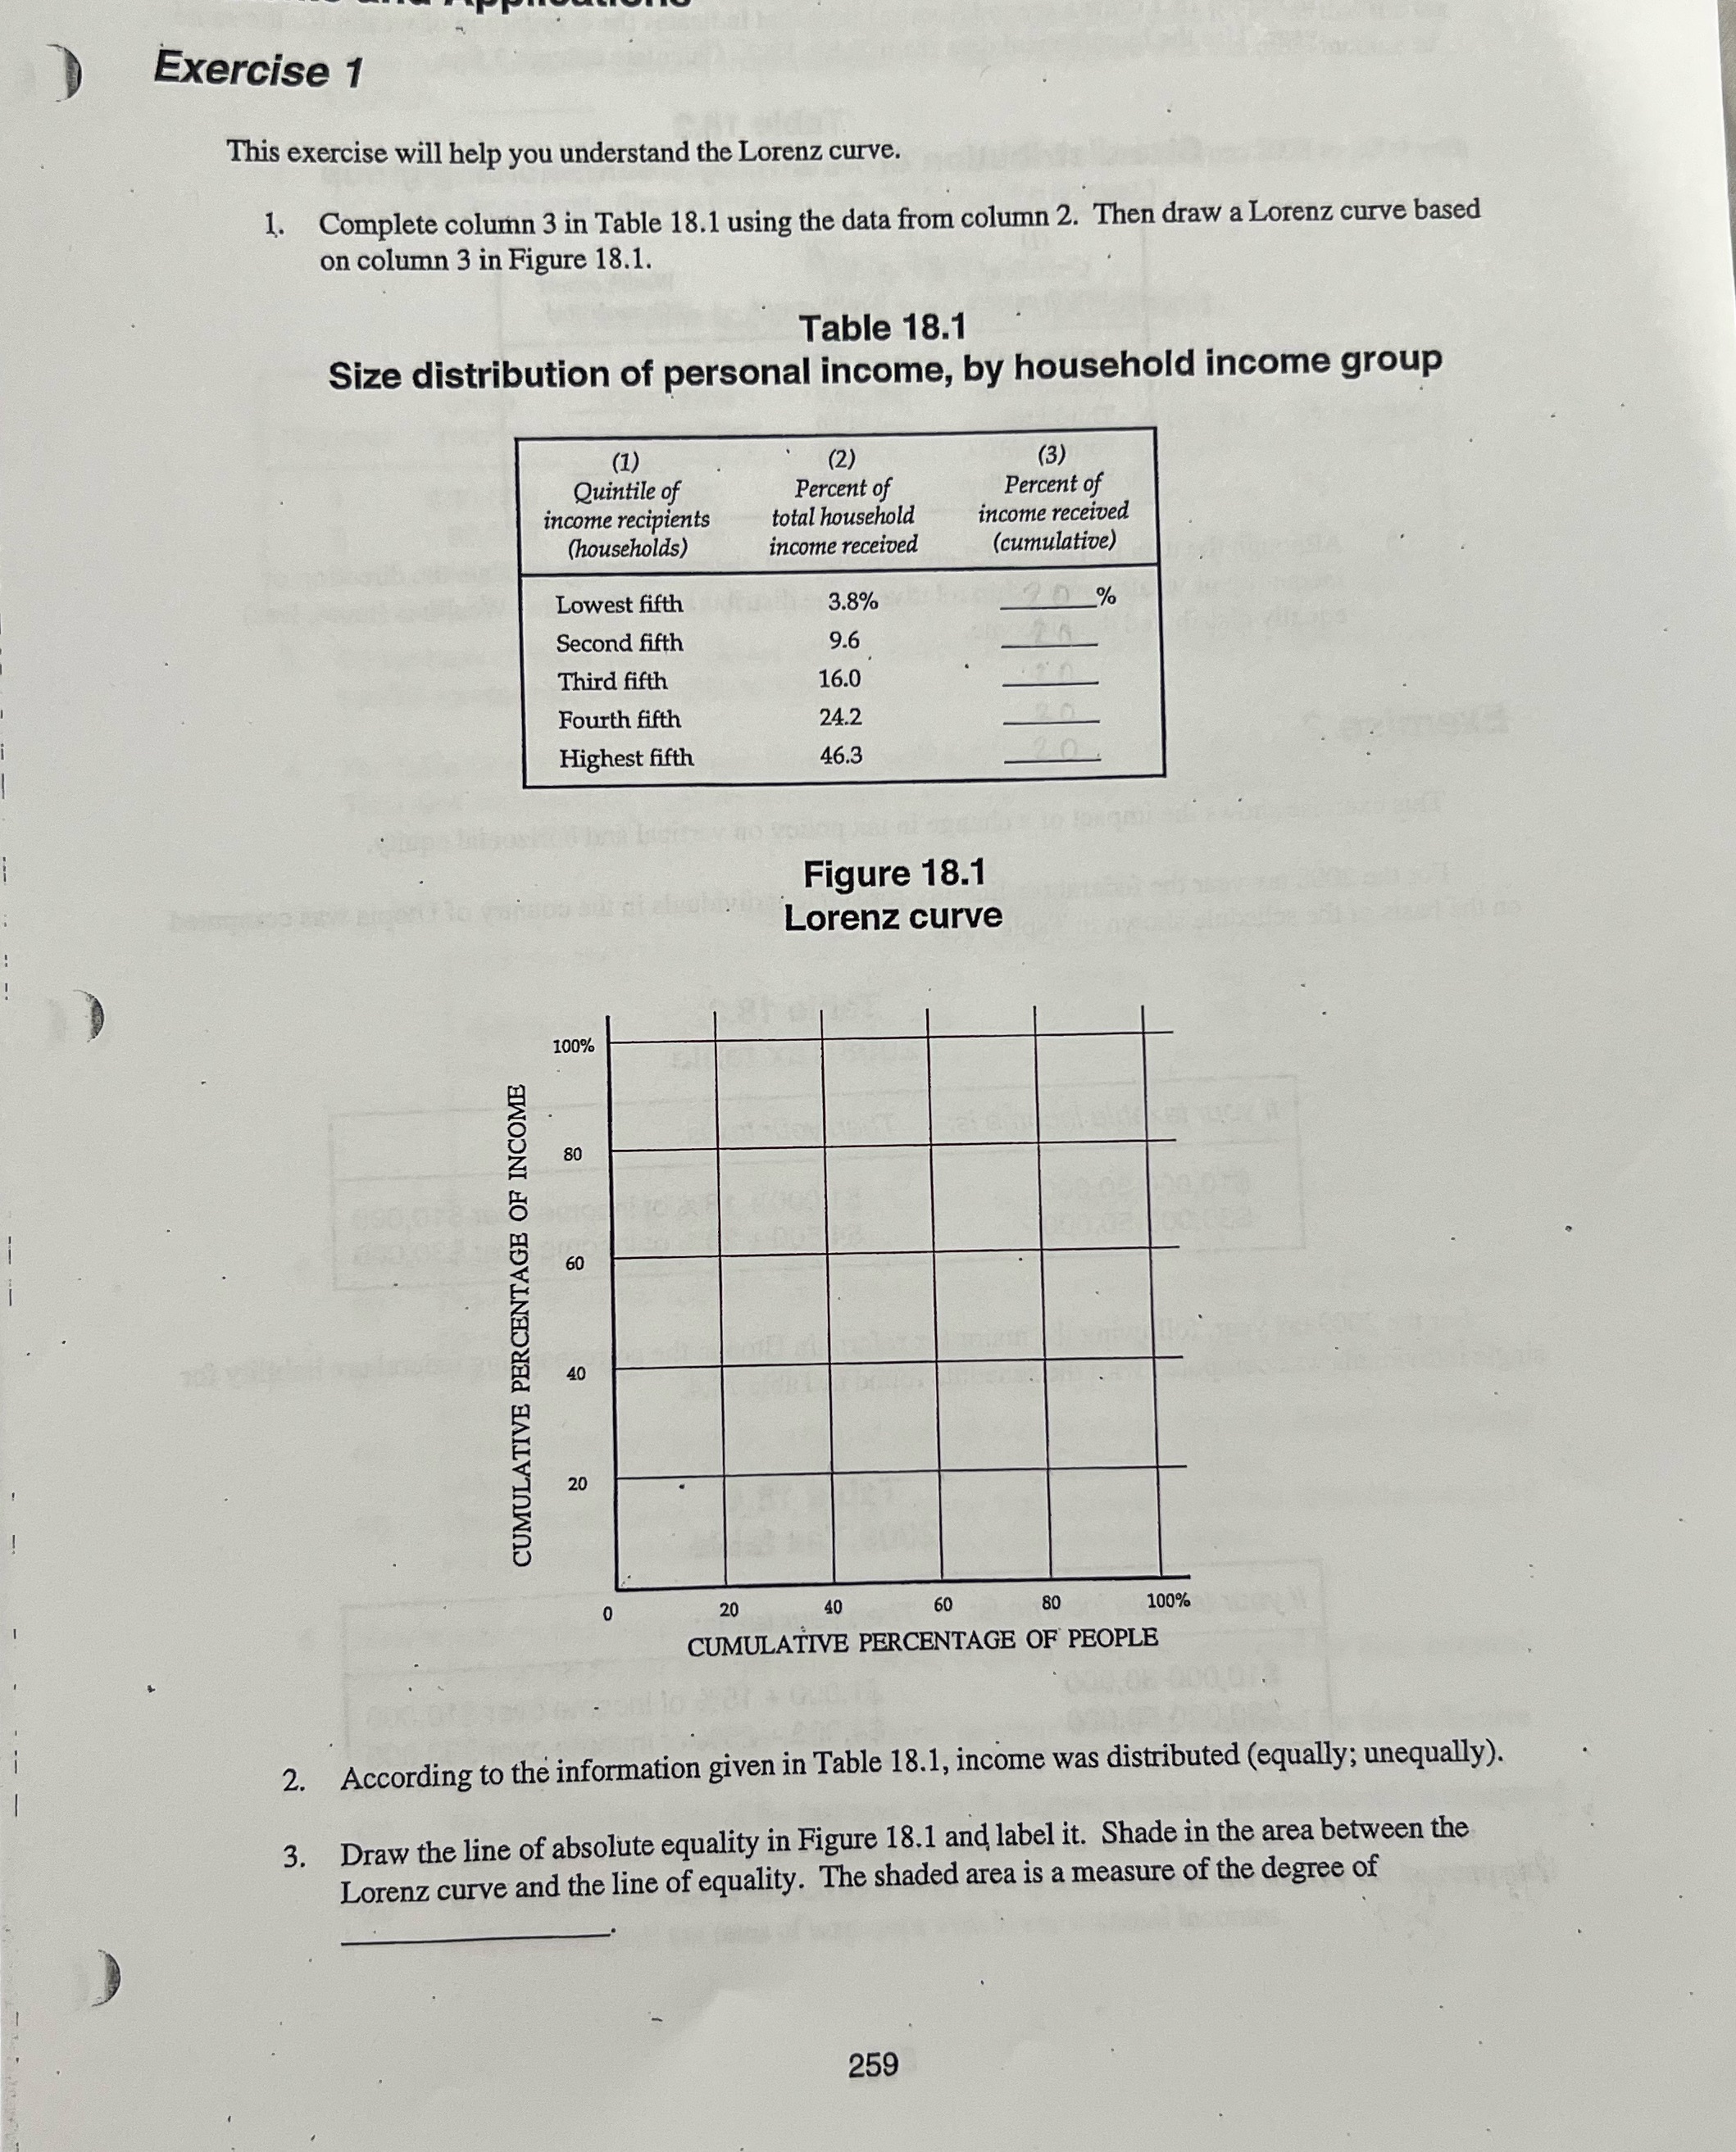
Exercise 1 This exercise will help you understand the Lorenz curve. 1. Complete column 3 in Table 18.1 using the data from column 2. Then draw a Lorenz curve based on column 3 in Figure 18.1. Table 18.1 Size distribution of personal income, by household income group (1) (2) (3) Quintile of Percent of Percent of income recipients total household income received (households income received (cumulative) Lowest fifth 3.8% % Second fifth 9.6 Third fifth 16.0 Fourth fifth 24.2 Highest fifth 46.3 Figure 18.1 Lorenz curve 100% 80 60 CUMULATIVE PERCENTAGE OF INCOME 40 20 20 40 60 80 100% CUMULATIVE PERCENTAGE OF PEOPLE 2. According to the information given in Table 18.1, income was distributed (equally; unequally). 3. Draw the line of absolute equality in Figure 18.1 and label it. Shade in the area between the Lorenz curve and the line of equality. The shaded area is a measure of the degree of 259
Step by Step Solution
There are 3 Steps involved in it

Get step-by-step solutions from verified subject matter experts