

Question: Exercise 1 Use the 6-week moving average method to calculate forecasts for all available periods given the data provided in the Excel template. Exercise 2
Exercise 1
Use the 6-week moving average method to calculate forecasts for all available periods given the data provided in the Excel template.
Exercise 2
Use the exponential smoothing method with alpha = 0.3 to calculate forecasts for all available periods given the data provided in the Excel template.
Exercise 3
Make a fair comparison between the above two models by bias and MSE. According to your analysis, which forecasting model is more accurate?
Please see the picture below. This needs to be done in excel. Please include your formulas used in excel! Thanks :)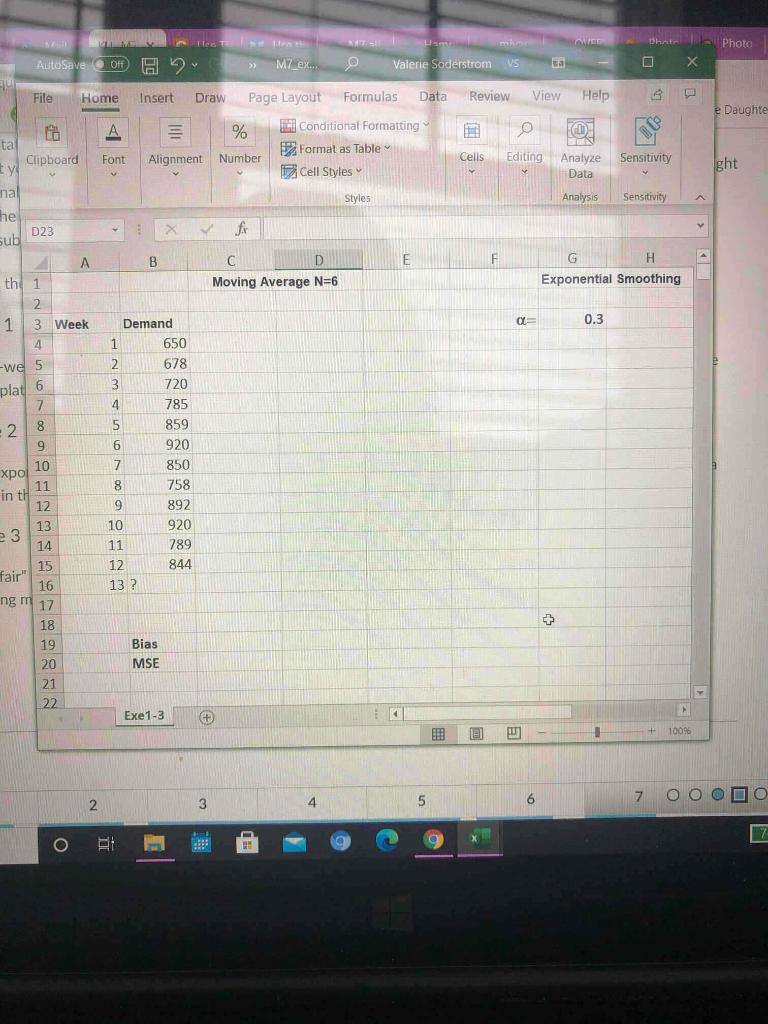
Step by Step Solution
There are 3 Steps involved in it
1 Expert Approved Answer
Step: 1 Unlock

Question Has Been Solved by an Expert!
Get step-by-step solutions from verified subject matter experts
Step: 2 Unlock
Step: 3 Unlock