

Question: Exercise 12-7 Shown below are comparative balance sheets for Sweet Acacia Industries. Additional information: 1. Net income for 2017 was $179,769. 2. Depreciation expense was
Exercise 12-7 Shown below are comparative balance sheets for Sweet Acacia Industries.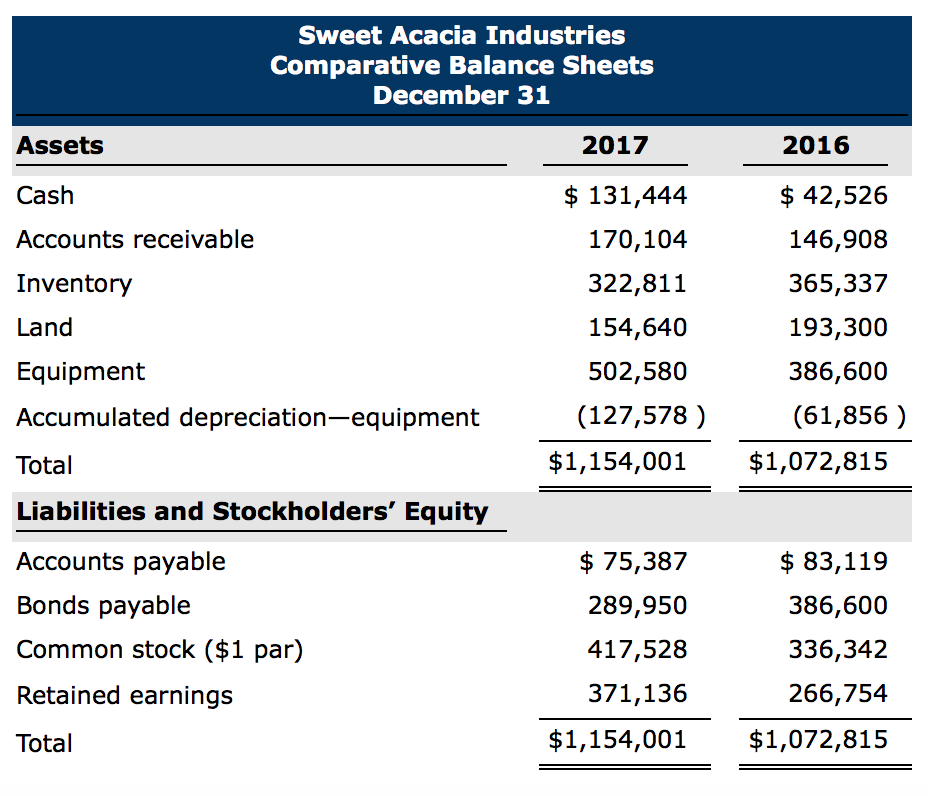
Additional information:
| 1. | Net income for 2017 was $179,769. | |
| 2. | Depreciation expense was $65,722. | |
| 3. | Cash dividends of $75,387 were declared and paid. | |
| 4. | Bonds payable amounting to $96,650 were redeemed for cash $96,650. | |
| 5. | Common stock was issued for $81,186 cash. | |
| 6. | No equipment was sold during 2017. | |
| 7. | Land was sold for its book value. |
Prepare a statement of cash flows for 2017 using the indirect method. (Show amounts that decrease cash flow with either a - sign e.g. -15,000, or in parenthesis e.g. (15,000)).
Sweet Acacia Industries Comparative Balance Sheets December 31 2017 Assets Cash Accounts receivable Inventory Land Equipment Accumulated depreciation-equipment Total Liabilities and Stockholders' Equity Accounts payable Bonds payable Common stock ($1 par) Retained earning:s Total 2016 $42,526 146,908 365,337 193,300 386,600 (61,856 ) $ 131,444 170,104 322,811 154,640 502,580 (127,578) $1,154,001$1,072,815 $83,119 386,600 336,342 266,754 $1,154,001 $1,072,815 $ 75,387 289,950 417,528 371,136
Step by Step Solution
There are 3 Steps involved in it

Get step-by-step solutions from verified subject matter experts