

Question: Exercise 12-7 Shown below are comparative balance sheets for Waterway Industries. Industries Comparative Balance Sheets December 31 Assets Cash Accounts receivablk 2017 2016 $74,160 24,090
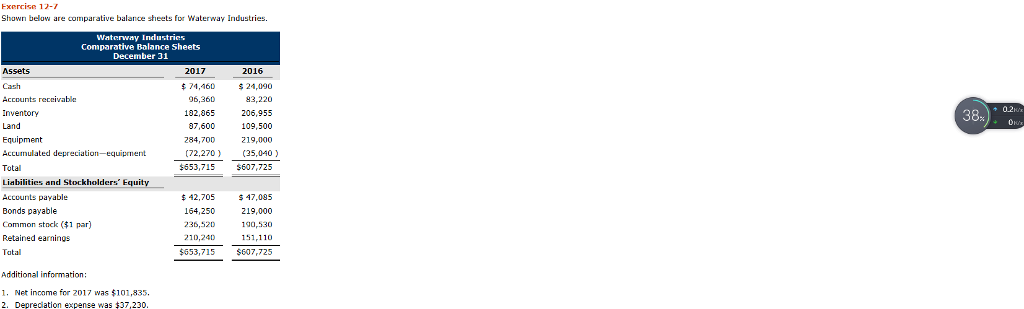
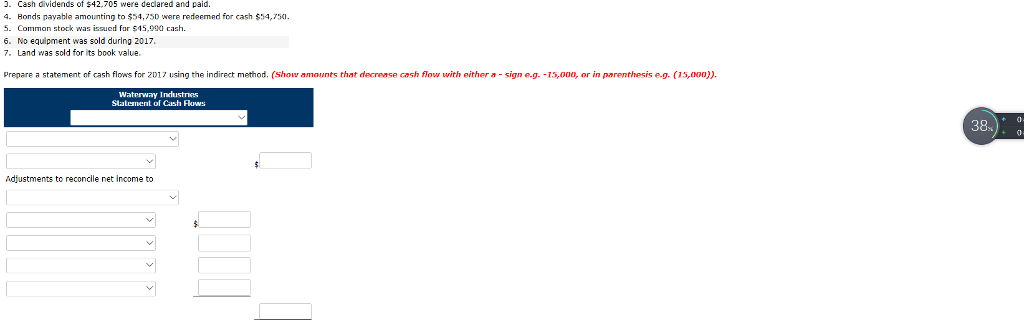

Exercise 12-7 Shown below are comparative balance sheets for Waterway Industries. Industries Comparative Balance Sheets December 31 Assets Cash Accounts receivablk 2017 2016 $74,160 24,090 93,220 206,955 109,500 219,000 38%) O Land Equipment 284,700 72,270 (5,040) 553,715 Total 607,725 Liabilities and Stockholders Equity Accounts payable Bonds payable Common stnck ($1 par) Retained earnings Tatal 42,705 164,250 236,520 210,24D $553,715 47,085 219,000 0,30 $607,725 Additional information 1. Net inoome for 2017 was $101,835. 2. Depreciation expense was $37,230
Step by Step Solution
There are 3 Steps involved in it
1 Expert Approved Answer
Step: 1 Unlock

Question Has Been Solved by an Expert!
Get step-by-step solutions from verified subject matter experts
Step: 2 Unlock
Step: 3 Unlock