

Question: Exercise 13-3 Computing and analyzing trend percents LO P1 2016 Sales Cost of goods sold Accounts receivable 2019 2018 2017 2015 $ 282,880 $ 270,800
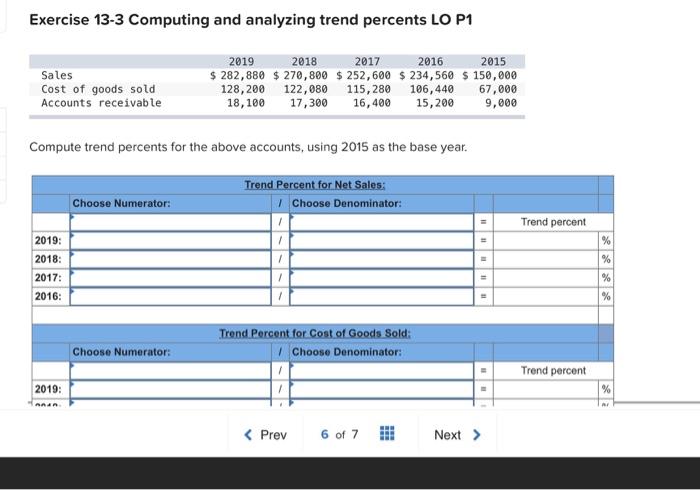
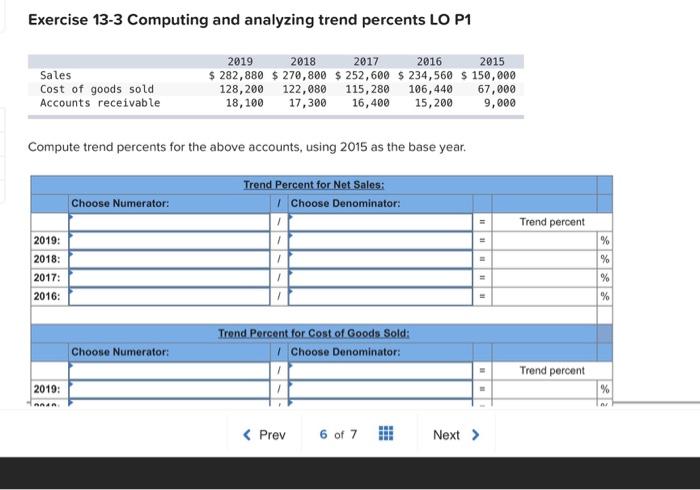
Exercise 13-3 Computing and analyzing trend percents LO P1 2016 Sales Cost of goods sold Accounts receivable 2019 2018 2017 2015 $ 282,880 $ 270,800 $ 252,600 $ 234,560 $ 150,000 128,200 122,080 115,280 106,440 67,000 18,100 17,300 16,400 15,200 9,000 Compute trend percents for the above accounts, using 2015 as the base year. Trend Percent for Net Sales: Choose Denominator: Choose Numerator: Trend percent % 2019: 2018: 1 % 2017: % % 2016: Trend Percent for Cost of Goods Sold: Choose Denominator: Choose Numerator: Trend percent 2019: % AAR MI Exercise 13-3 Computing and analyzing trend percents LO P1 2018 Sales Cost of goods sold Accounts receivable 2019 2017 2016 2015 $ 282,880 $ 270,800 $ 252,600 $ 234,560 $ 150,000 128,200 122,080 115,280 106,440 67,000 18,100 17,300 16,400 15,200 9,000 Compute trend percents for the above accounts, using 2015 as the base year. Trend Percent for Net Sales: Choose Denominator: Choose Numerator: Trend percent % % 2019: 2018: 2017: 2016: % % Trond Percent for Cost of Goods Sold: Choose Denominator: Choose Numerator: Trend percent 2019: %
Step by Step Solution
There are 3 Steps involved in it

Get step-by-step solutions from verified subject matter experts