

Question: Exercise 13-3 Computing and interpreting trend percents LO P1 Sales Cost of goods sold Accounts receivable 2019 2018 2017 2016 2015 $ 739,454 $ 480,165
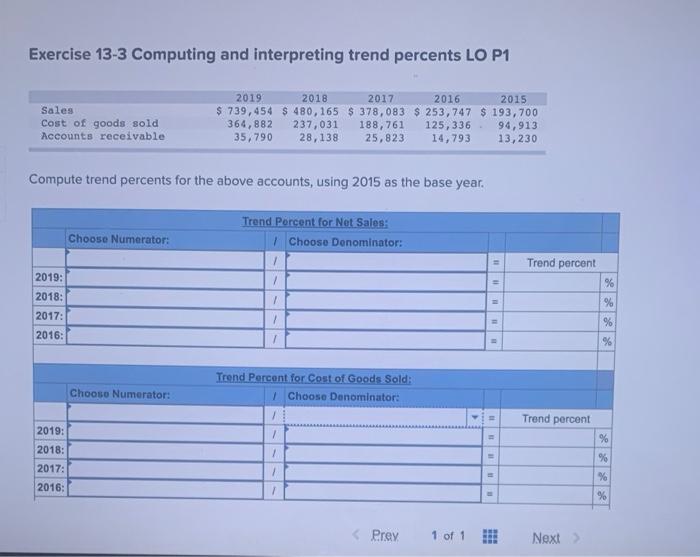
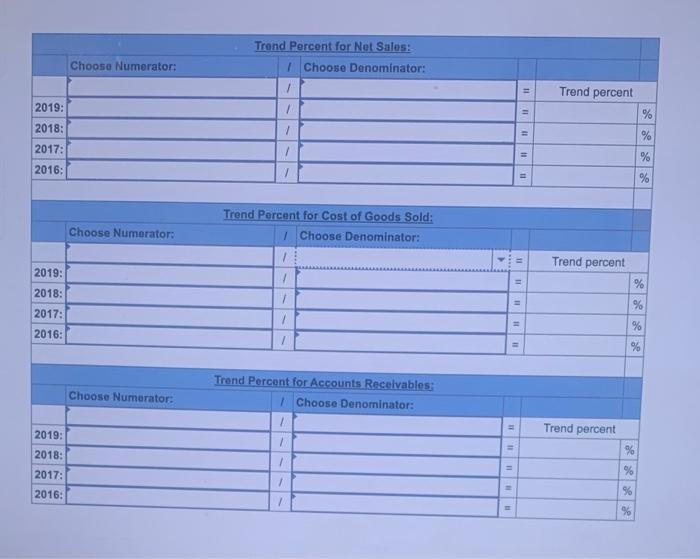
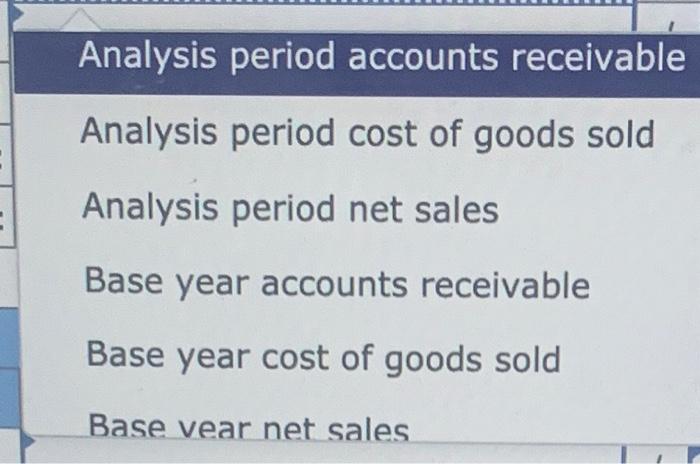
Exercise 13-3 Computing and interpreting trend percents LO P1 Sales Cost of goods sold Accounts receivable 2019 2018 2017 2016 2015 $ 739,454 $ 480,165 $ 378,083 $ 253, 747 $ 193,700 364,882 237,031 188,761 125,336 94,913 35, 790 28,138 25,823 14,793 13,230 Compute trend percents for the above accounts, using 2015 as the base year. Trend Porcent for Net Sales: 1 Choose Denominator: Choose Numerator: 1 Trend percent / = % 1 2019: 2018: 2017: 2016: % / % % Trend Percent for Cost of Goods Sold: 1 Choose Denominator: Chooso Numerator: Trend percent = % 2019: 2018: 2017: % / 2016: % % Prey 1 of 1 Next Trond Percent for Net Sales: Choose Numerator: 1 Choose Denominator: 1 1 Trend percent 2019: / 11 % 2018: 2017: #11 % % / 2016: % Choose Numerator Trend Percent for Cost of Goods Sold: 1 Choose Denominator: 1 1 Trend percent 2019: % 2018: 7 2017: 2016: % % 1 11 / Choose Numerator: Trond Percent for Accounts Receivables: 1 Choose Denominator: 11 Trend percent 2019: 2018: % 1 % 2017: 2016: / / % % Analysis period accounts receivable Analysis period cost of goods sold Analysis period net sales Base year accounts receivable Base year cost of goods sold Base vear net sales
Step by Step Solution
There are 3 Steps involved in it

Get step-by-step solutions from verified subject matter experts