

Question: Exercise 13-3 Here is financial information for Windsor, Inc. December December 31:201731, 2016 108,800 402,700 101,700 124,800 132,900 152,200 92,700 352,800 67,800 92,700 117,900 167,200
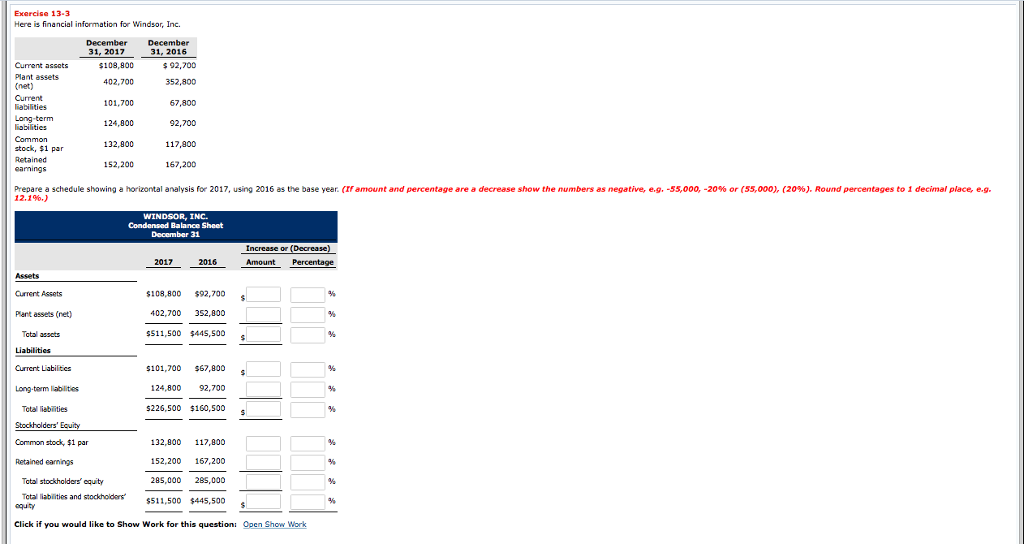
Exercise 13-3 Here is financial information for Windsor, Inc. December December 31:201731, 2016 108,800 402,700 101,700 124,800 132,900 152,200 92,700 352,800 67,800 92,700 117,900 167,200 Current assets Plant assets (net) Current Long-term stock, $1 par Prepare a schedule showing a horizontal analysis for 2017, usi ? 2016 as the base year. 12.1%.) If amount and percentage are a decrease show the numbers as negative, e g 55,000, 20% or 55,000 (20%). Round percentages to 1 decimal place, e.g WINDSOR, INC. Condensed Balance Sheet 2017 2016 Assets Current Assets Plant assets (net) $108,800 92,700 402,700 352,800 511,500 $44S,500 Total acts Current Liabilites 101,700 $67,800 124,800 92,700 $226,500 $160,500 s Long-term labilites Tota liabiities 132,900 117,800 152,200 167,200 285,000 28S,000 511,500 $445,500 Common stock, $1 par Retained earnings Tctal stockholders equity Tctal liabiities and stockhoiders oquty Click if you would like to Show Work for this questioni Open Show Work
Step by Step Solution
There are 3 Steps involved in it

Get step-by-step solutions from verified subject matter experts