

Question: Exercise 13-4 Operating data for Concord Corporation are presented below 2017 2016 Sales revenue Cost of goods sold Selling expenses Administrative expenses Income tax expense
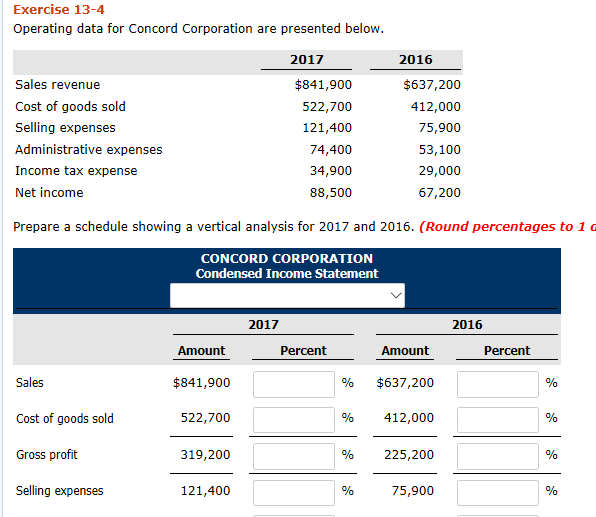
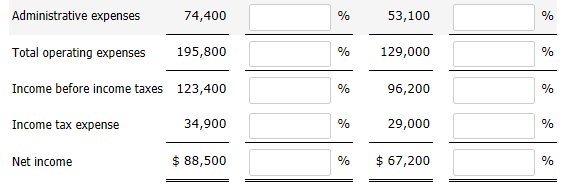
Exercise 13-4 Operating data for Concord Corporation are presented below 2017 2016 Sales revenue Cost of goods sold Selling expenses Administrative expenses Income tax expense Net income $841,900 522,700 121,400 74,400 34,900 88,500 $637,200 412,000 75,900 53,100 29,000 67,200 Prepare a schedule showing a vertical analysis for 2017 and 2016. (Round percentages to 1 G CONCORD CORPORATION Condensed Income Statement 2017 2016 Amount Percent Amount 96 $637,200 % 412,000 96 225,200 75,900 Percent Sales Cost of goods sold Gross proft Selling expenses $841,900 522,700 319,200 121,400
Step by Step Solution
There are 3 Steps involved in it
1 Expert Approved Answer
Step: 1 Unlock

Question Has Been Solved by an Expert!
Get step-by-step solutions from verified subject matter experts
Step: 2 Unlock
Step: 3 Unlock