

Question: Exercise 13-4 Operating data for Swifty Corporation are presented below. 2017 2016 Sales revenue $830,700 529,000 124,700 78,800 33,500 64,700 $634,900 415,000 73,600 53,900 23,400
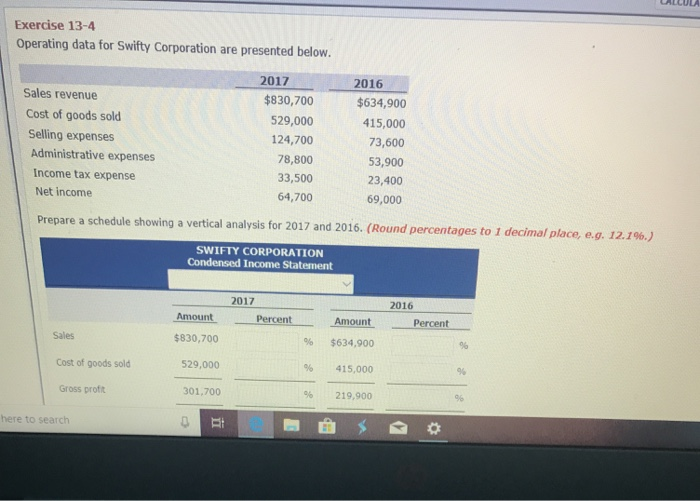
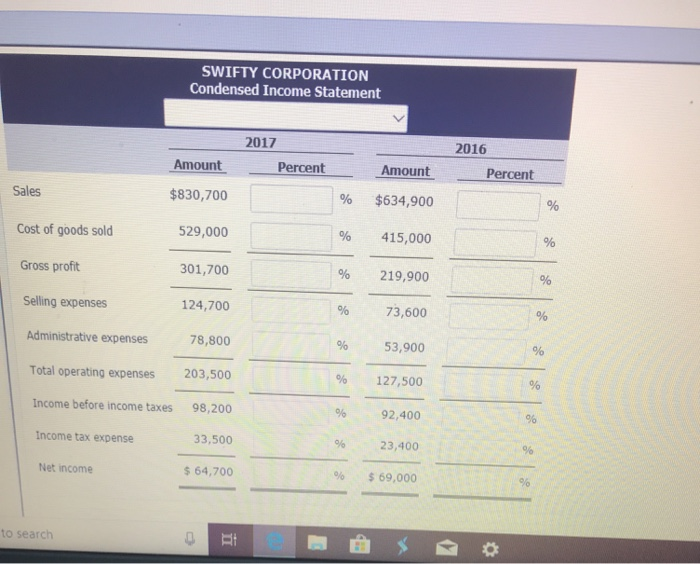
Exercise 13-4 Operating data for Swifty Corporation are presented below. 2017 2016 Sales revenue $830,700 529,000 124,700 78,800 33,500 64,700 $634,900 415,000 73,600 53,900 23,400 69,000 Cost of goods sold Selling expenses Administrative expenses Income tax expense Net income Prepare a schedule showing a vertical analysis for 2017 and 2016. (Round percentages to 1 decimal place, eg, 12.1%) SWIFTY CORPORATION Condensed Income Statement 2017 2016 Amsunt PerentAmeint Amount % $634,900 96 415,000 % 219,900 Percent Sales Cost of goods sold Gross prof $830,700 529,000 301,700 here to search SWIFTY CORPORATION Condensed Income Statement 2017 2016 Percent Percent Amount % $634,900 % 415,000 % 219,900 % 73,600 % 53,900 96 127,500 % 92,400 % 23,400 % $69,000 Amount Sales $830,700 Cost of goods sold 529,000 Gross profit Selling expenses Administrative expenses 301,700 124,700 78,800 203,500 98,200 Total operating expenses Income before income taxes Income tax expense Net income 33,500 64,700 to search
Step by Step Solution
There are 3 Steps involved in it

Get step-by-step solutions from verified subject matter experts