

Question: Exercise 13-9 Risk and capital structure analysis LO P3 [The following information applies to the questions displayed below.] Simon Companys year-end balance sheets follow. Simon
Exercise 13-9 Risk and capital structure analysis LO P3
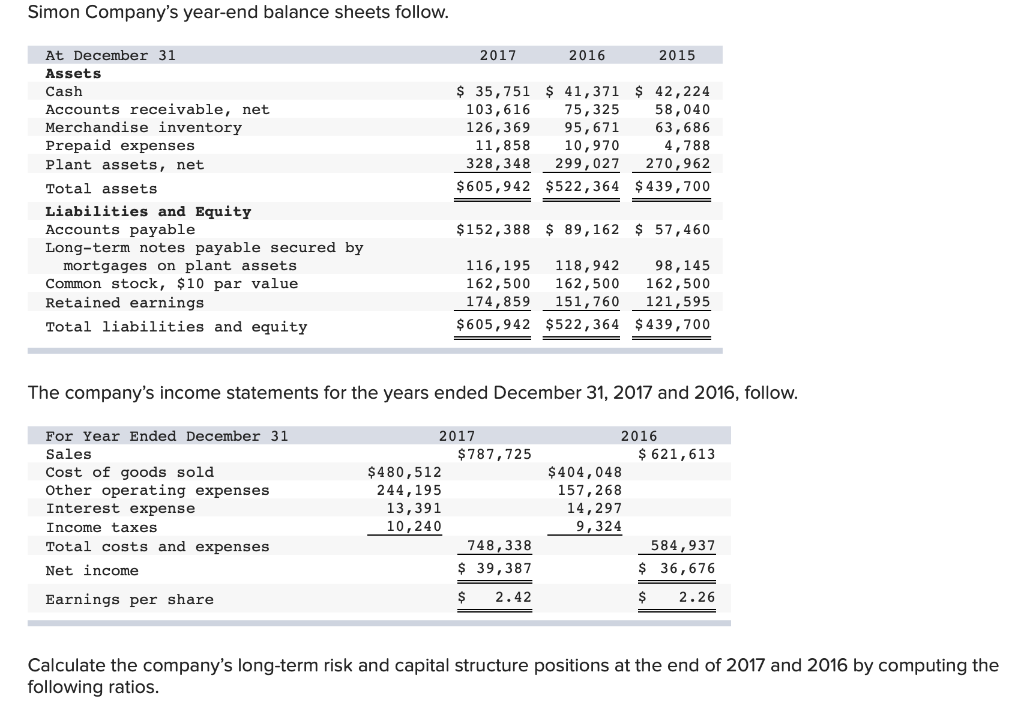
[The following information applies to the questions displayed below.] Simon Companys year-end balance sheets follow.
![applies to the questions displayed below.] Simon Companys year-end balance sheets follow.](https://dsd5zvtm8ll6.cloudfront.net/si.experts.images/questions/2024/09/66ea6db66bcf8_54266ea6db608fcc.jpg)
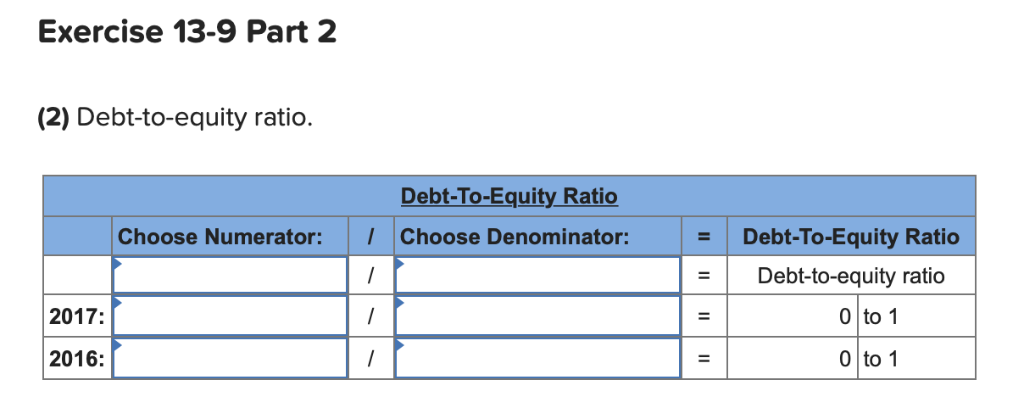
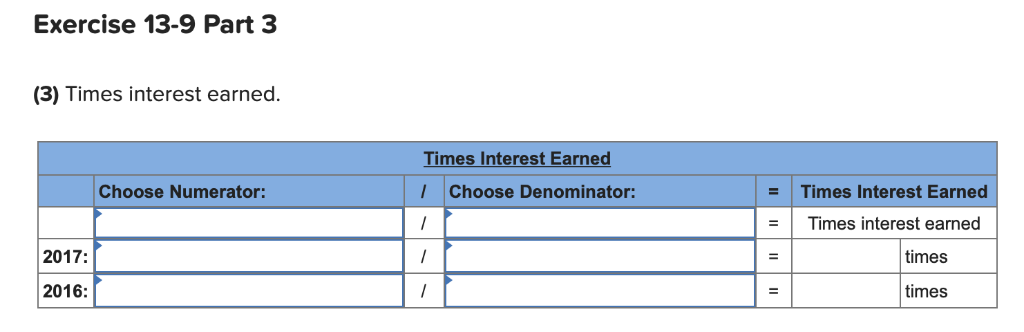
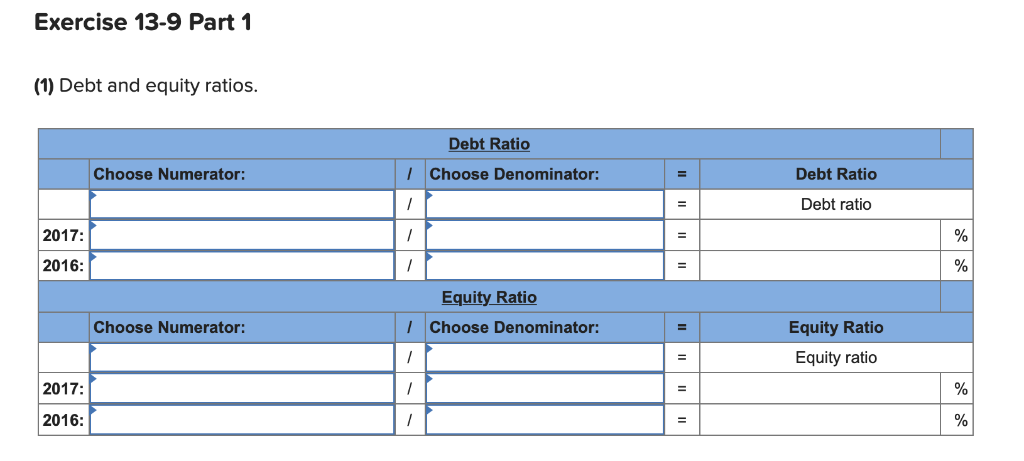
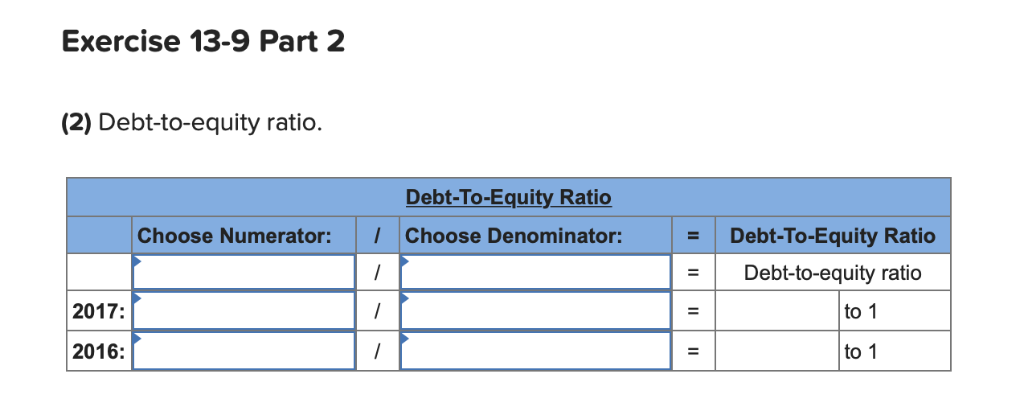
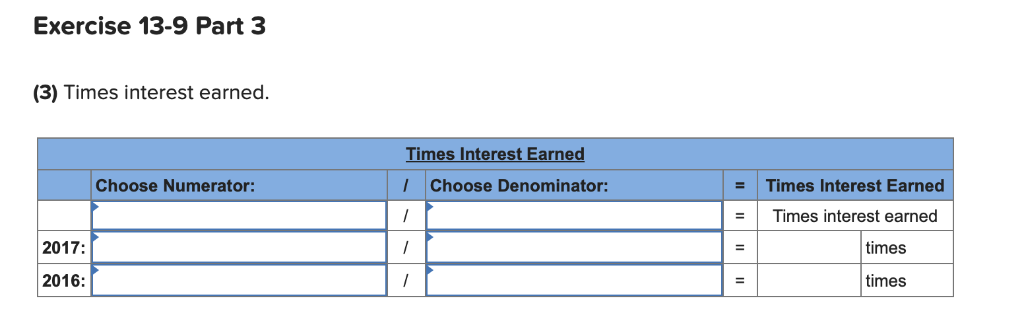
Simon Company's year-end balance sheets follow. 2016 At December 31 2017 2015 Assets $ 42,224 58,040 63,686 4,788 270,962 Cash 35,751 $ 41,371 103,616 126,369 11,858 328,348 Accounts receivable, net 75,325 95,671 10,970 299,027 Merchandise inventory Prepaid expenses Plant assets, net $605,942 $522,364 $439,700 Total assets Liabilities and Equity Accounts payable Long-term notes payable secured by mortgages on plant assets Common stock, $10 par value Retained earnings $ 89,162 $ 57,460 $152,388 116,195 162,500 174,859 118,942 162,500 151,760 98,145 162,500 121,595 $605,942 $522,364 $ 439,700 Total liabilities and equity The company's income statements for the years ended December 31, 2017 and 2016, follow. For Year Ended December 31 2017 2016 $787,725 $621,613 Sales $480,512 $404,048 Cost of goods sold Other operating expenses 244,195 13,391 157,268 14,297 9,324 Interest expense 10,240 Income taxes 748,338 584,937 Total costs and expenses $36,676 $39,387 Net income 2.42 $ 2.26 Earnings per share Calculate the company's long-term risk and capital structure positions at the end of 2017 and 2016 by computing the following ratios. Exercise 13-9 Part 1 (1) Debt and equity ratios. Debt Ratio Debt Ratio Choose Numerator: Choose Denominator: Debt ratio 2017: / 2016: % Equity Ratio IChoose Denominator: Choose Numerator: Equity Ratio Equity ratio 2017: % = 2016: % Exercise 13-9 Part 2 (2) Debt-to-equity ratio. Debt-To-Equity Ratio Choose Numerator: Choose Denominator: Debt-To-Equity Ratio Debt-to-equity ratio 2017: 0 to 1 0 to 1 2016: / Exercise 13-9 Part 3 (3) Times interest earned Times Interest Earned Times Interest Earned Choose Numerator: Choose Denominator: / Times interest earned 2017: times 2016: times = Exercise 13-9 Part 1 (1) Debt and equity ratios. Debt Ratio IChoose Denominator: Choose Numerator: Debt Ratio / Debt ratio = 2017: / = 2016: % Equity Ratio /Choose Denominator: Choose Numerator: Equity Ratio Equity ratio / 2017 / % 2016: / % Exercise 13-9 Part 2 (2) Debt-to-equity ratio. Debt-To-Equity Ratio Choose Numerator: Choose Denominator: Debt-To-Equity Ratio / Debt-to-equity ratio 2017: / to 1 2016: / to 1 Exercise 13-9 Part 3 (3) Times interest earned Times Interest Earned Times Interest Earned Choose Numerator: Choose Denominator: Times interest earned 2017: times 2016: times
Step by Step Solution
There are 3 Steps involved in it

Get step-by-step solutions from verified subject matter experts