

Question: Exercise 13-9 Sandh Co. has these comparative balance sheet data: SANDHILL CO Balance Sheets December 31 2017 2016 $33,450 156,100 133,800 446,000 $769,350 $ 111,500
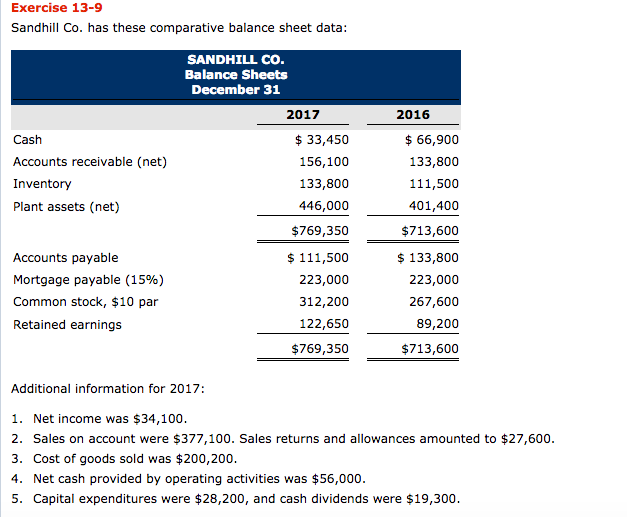
Exercise 13-9 Sandh Co. has these comparative balance sheet data: SANDHILL CO Balance Sheets December 31 2017 2016 $33,450 156,100 133,800 446,000 $769,350 $ 111,500 223,000 312,200 122,650 $769,350 66,900 133,800 111,500 401,400 $713,600 $133,800 223,000 267,600 89,200 $713,600 Cash Accounts receivable (net) Inventory Plant assets (net) Accounts payable Mortgage payable (15%) Common stock, $10 par Retained earnings Additional information for 2017: 1. Net income was $34,100 2. Sales on account were $377,100. Sales returns and allowances amounted to $27,600 3. Cost of goods sold was $200,200 4. Net cash provided by operating activities was $56,000 5. Capital expenditures were $28,200, and cash dividends were $19,300
Step by Step Solution
There are 3 Steps involved in it

Get step-by-step solutions from verified subject matter experts