

Question: Exercise 13-9 (Static) Analyzing risk and capital structure LO P3 [Alternate Version) [The following information applies to the questions displayed below) Simon Company's year-end balance
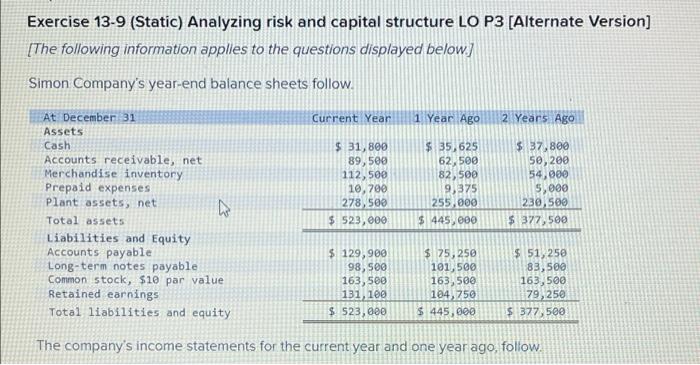
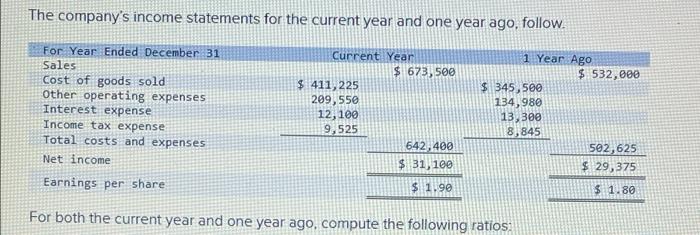
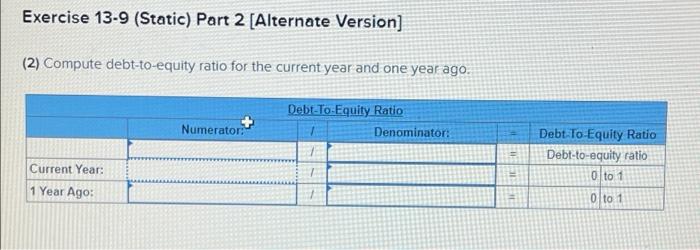
Exercise 13-9 (Static) Analyzing risk and capital structure LO P3 [Alternate Version) [The following information applies to the questions displayed below) Simon Company's year-end balance sheets follow. Current Year 1 Year Ago 2 Years Ago $ 31,800 89,500 112,500 10,700 278,500 $ 523,000 $ 35,625 62,500 82,500 9,375 255,000 At December 31 Assets Cash Accounts receivable, net Merchandise inventory Prepaid expenses Plant assets, net ho Total assets Liabilities and Equity Accounts payable Long-term notes payable Common stock, $10 par value Retained earnings Total liabilities and equity $ 37,800 50,200 54,000 5,000 230,500 $ 377,500 $ 445,000 $ 129,900 98,500 163,500 131, 100 $ 523,000 $ 75,250 101,500 163,500 104,750 $ 445,000 $ 51,250 83,500 163,500 79,250 $ 377,500 The company's income statements for the current year and one year ago, follow The company's income statements for the current year and one year ago, follow. For Year Ended December 31 Sales Cost of goods sold Other operating expenses Interest expense Income tax expense Total costs and expenses Net income Earnings per share Current Year $ 673,500 $ 411,225 209,550 12,100 9,525 642,400 $ 31,100 1 Year Ago $ 532,000 $ 345,500 134,980 13,300 8,845 502,625 $ 29,375 $ 1.90 $ 1180 For both the current year and one year ago, compute the following ratios. Exercise 13-9 (Static) Part 2 [Alternate Version] (2) Compute debt-to-equity ratio for the current year and one year ago. Numerator: Debt-To-Equity Ratio Denominator: Current Year: 1 Year Ago: LIEL Debt To Equity Ratio Debt-to-equity ratio 0 to 1 0 to 1
Step by Step Solution
There are 3 Steps involved in it

Get step-by-step solutions from verified subject matter experts