

Question: Exercise 14-5 Selected comparative financial statement data for Handley Inc. are shown below. 2016 $ HANDLEY INC. Statement of Financial Position (partial) December 31 (in
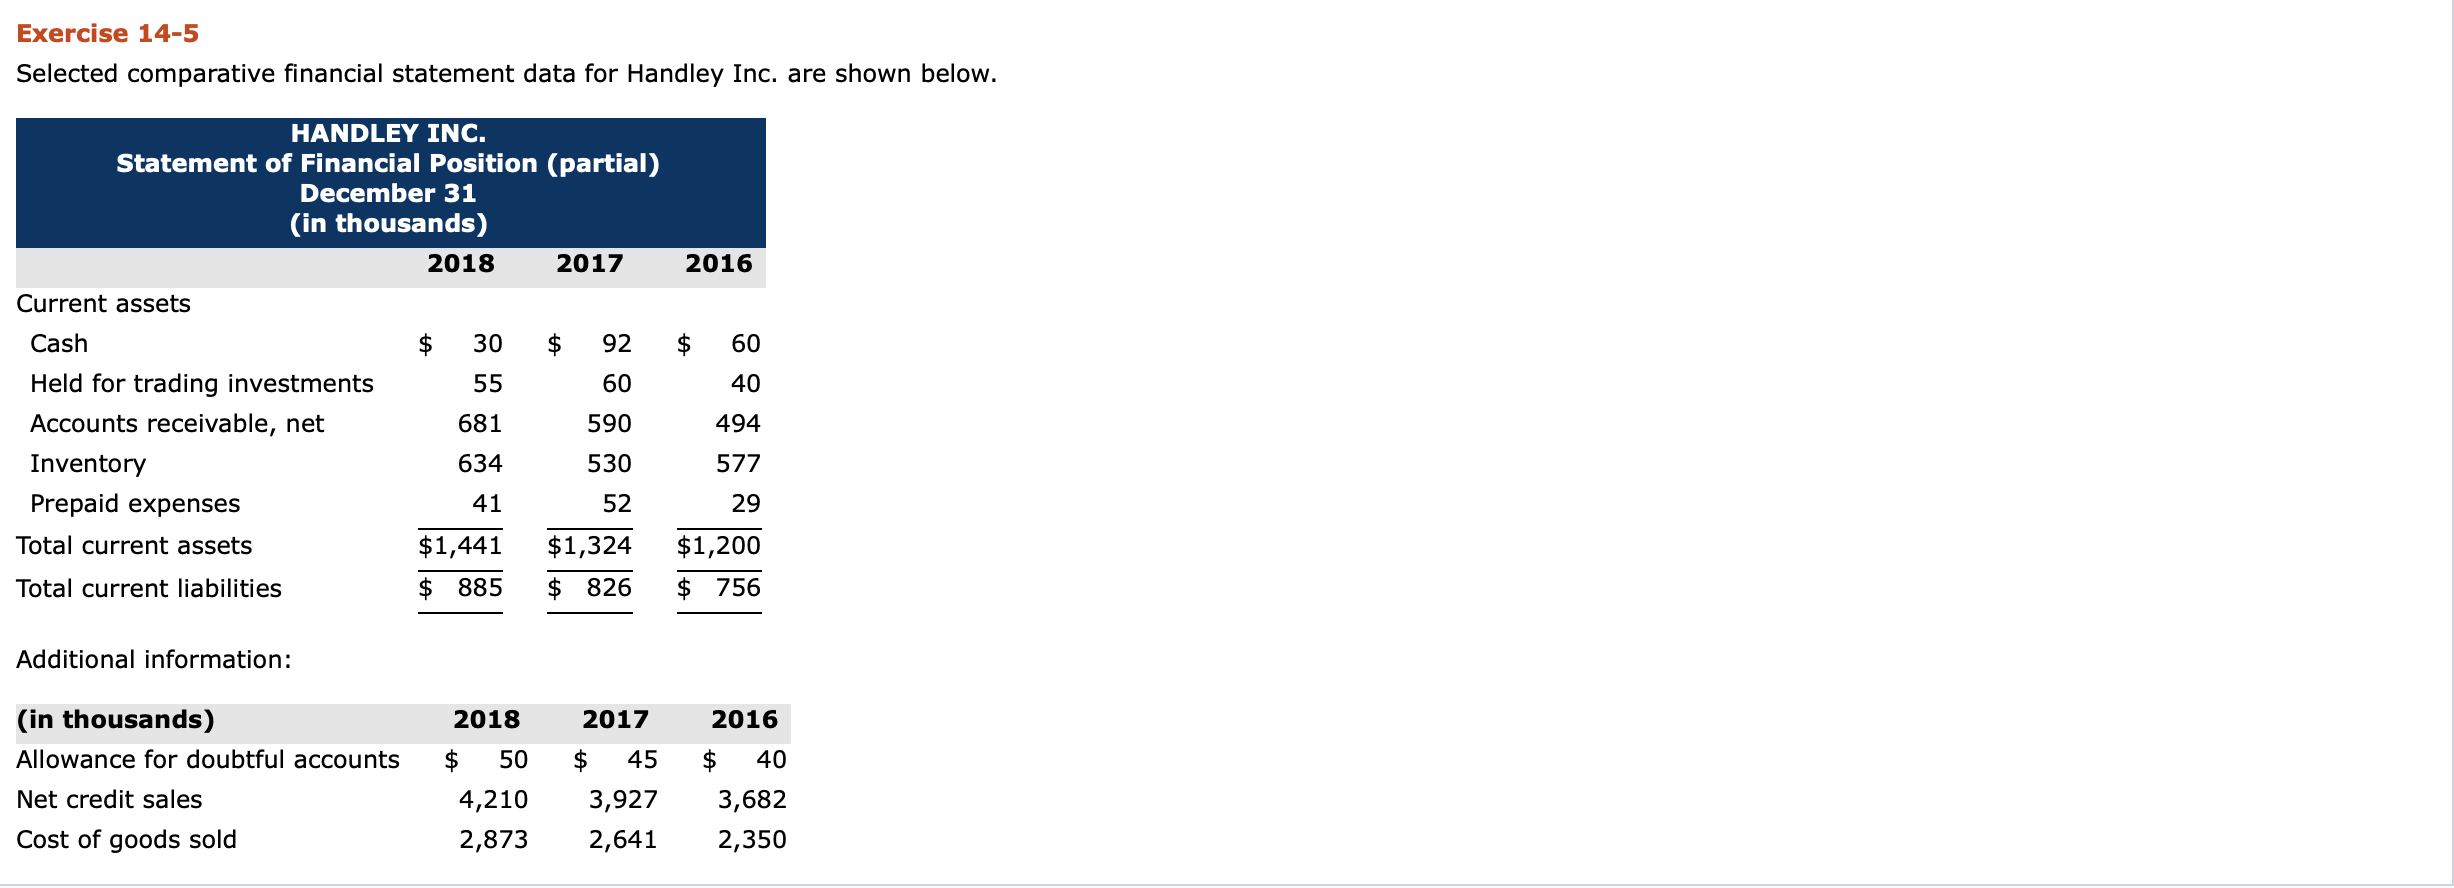
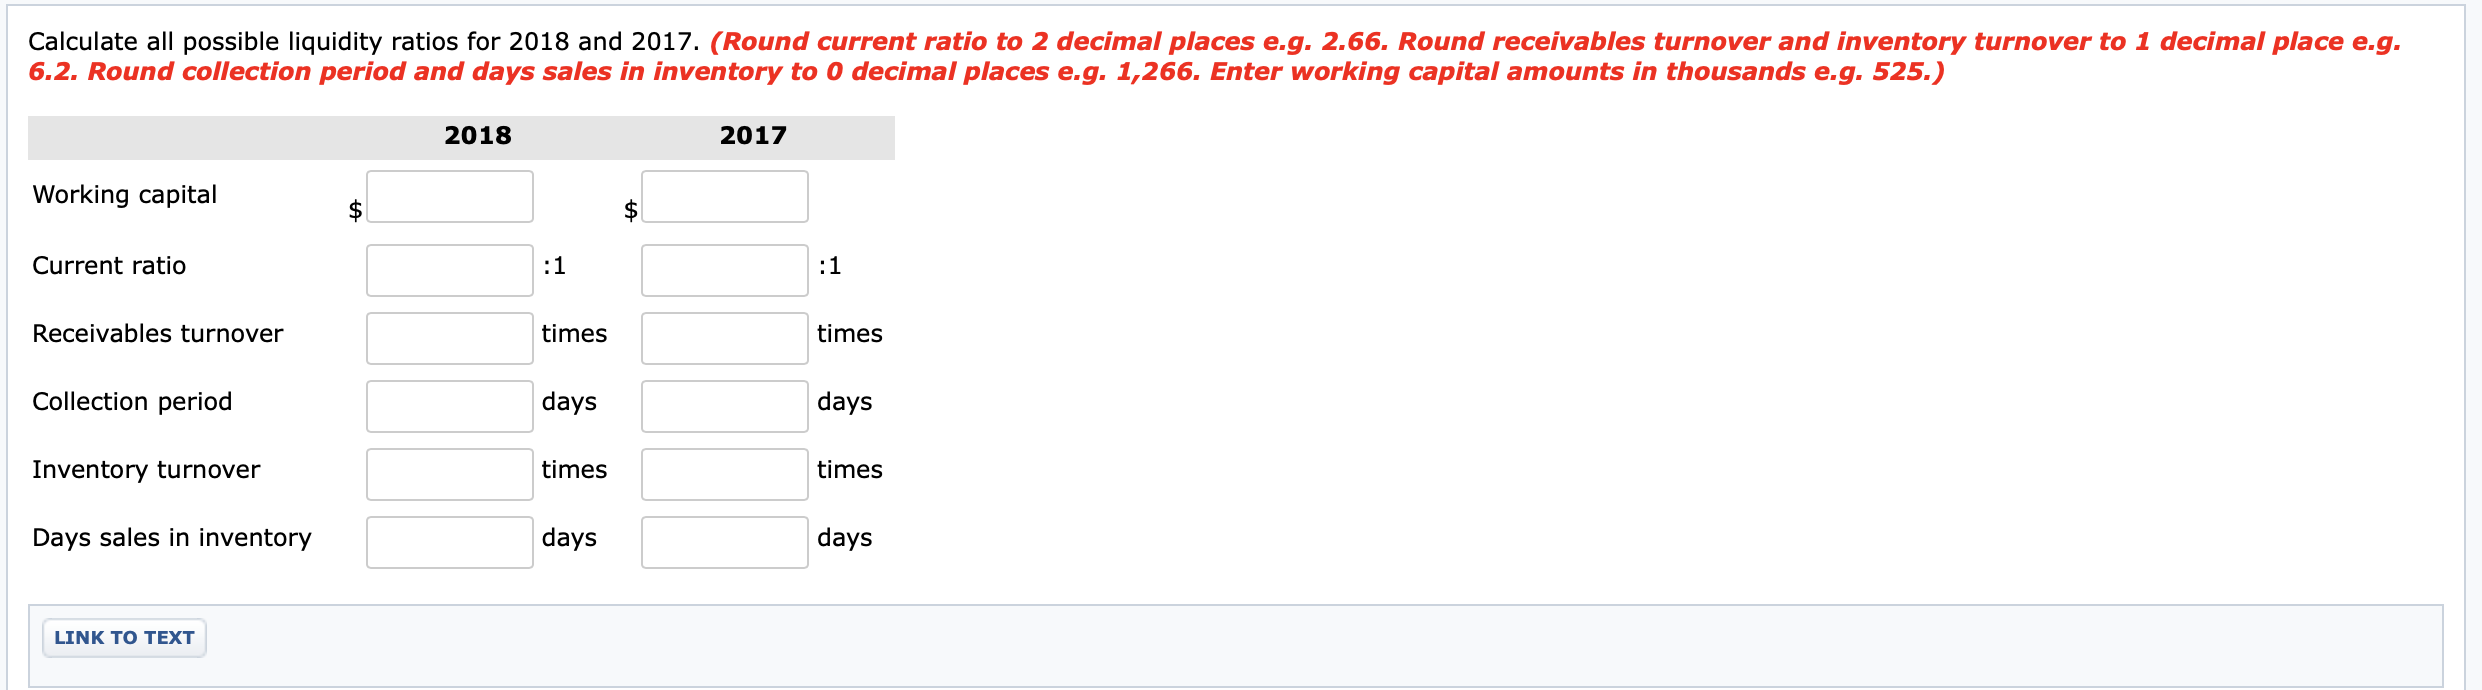
Exercise 14-5 Selected comparative financial statement data for Handley Inc. are shown below. 2016 $ HANDLEY INC. Statement of Financial Position (partial) December 31 (in thousands) 2018 2017 Current assets Cash $ 30 $ 92 Held for trading investments 55 Accounts receivable, net 681 590 Inventory 634 530 Prepaid expenses 52 Total current assets $1,441 $1,324 Total current liabilities $ 885 $ 826 60 40 60 494 577 41 29 $1,200 $ 756 Additional information: (in thousands) Allowance for doubtful accounts Net credit sales Cost of goods sold 2018 $ 50 4,210 2,873 2017 $ 45 3,927 2,641 2016 $ 40 3,682 2,350 Calculate all possible liquidity ratios for 2018 and 2017. (Round current ratio to 2 decimal places e.g. 2.66. Round receivables turnover and inventory turnover to 1 decimal place e.g. 6.2. Round collection period and days sales in inventory to 0 decimal places e.g. 1,266. Enter working capital amounts in thousands e.g. 525.) 2018 2017 Working capital $ Current ratio :1 :1 Receivables turnover times times Collection period days days Inventory turnover times times Days sales in inventory days days LINK TO TEXT
Step by Step Solution
There are 3 Steps involved in it

Get step-by-step solutions from verified subject matter experts