

Question: Exercise 14-9 Lendell Company has these comparative balance sheet data: Lendell Company Balance Sheets December 31 2020 2019 $16,000 31,000 Cash 61,000 70,000 Accounts receivable
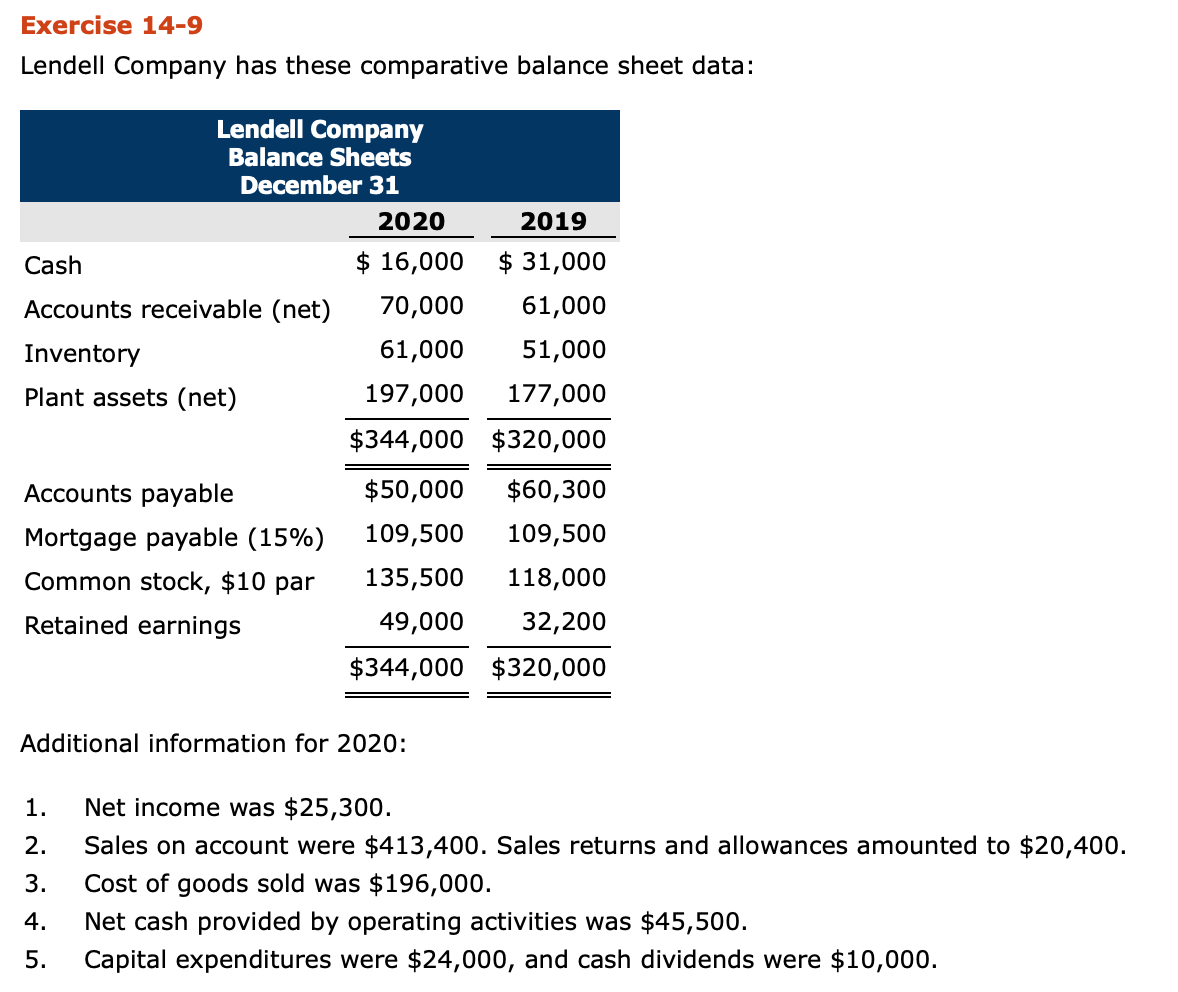
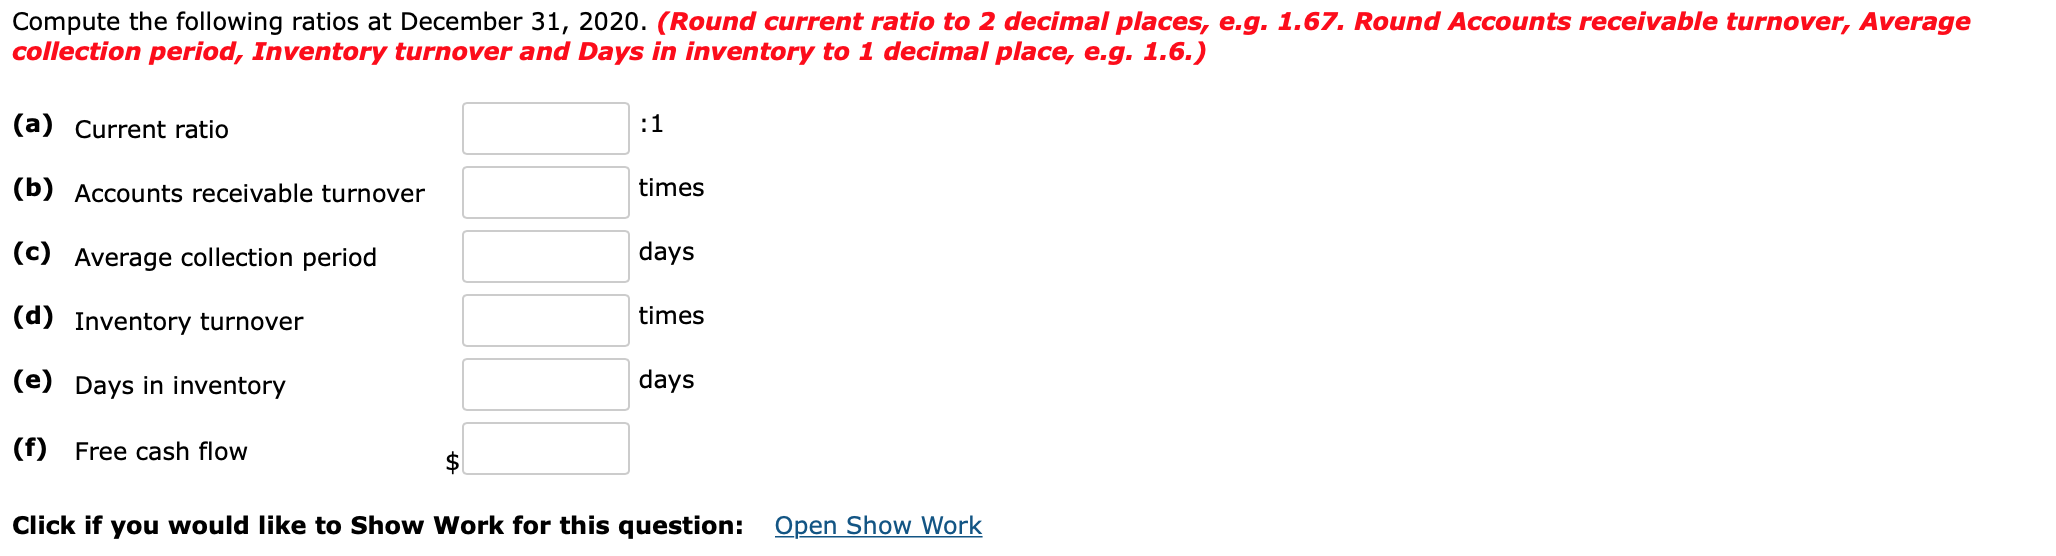
Exercise 14-9 Lendell Company has these comparative balance sheet data: Lendell Company Balance Sheets December 31 2020 2019 $16,000 31,000 Cash 61,000 70,000 Accounts receivable (net) 61,000 51,000 Inventory 177,000 197,000 Plant assets (net) $344,000 $320,000 $50,000 $60,300 Accounts payable 109,500 109,500 Mortgage payable (15%) Common stock, $10 par 118,000 135,500 49,000 32,200 Retained earnings $344,000 $320,000 Additional information for 2020: Net income was $25,300. 1. Sales on account were $413,400. Sales returns and allowances amounted to $20,400 2. Cost of goods sold was $196,000 Net cash provided by operating activities was $45,500 3 4. Capital expenditures were $24,000, and cash dividends were $10,000. 5. Compute the following ratios at December 31, 2020. (Round current ratio to 2 decimal places, e.g. 1.67. Round Accounts receivable turnover, Average collection period, Inventory turnover and Days in inventory to 1 decimal place, e.g. 1.6.) :1 (a) Current ratio times (b) Accounts receivable turnover days (c) Average collection period times (d) Inventory turnover (e) Days in inventory days (f) Free cash flow $ Open Show Work Click if you would like to Show Work for this
Step by Step Solution
There are 3 Steps involved in it

Get step-by-step solutions from verified subject matter experts