

Question: Exercise 18-1 Cost behavior in graphs C1 Following are five graphs representing various cost behaviors. (1) Identify whether the cost behavior in each graph is
Exercise 18-1 Cost behavior in graphs C1
Following are five graphs representing various cost behaviors. (1) Identify whether the cost behavior in each graph is mixed, step-wise, fixed, variable, or curvilinear. (2) Identify the graph (by number) that best illustrates each cost behavior: (a) Factory policy requires one supervisor for every 30 factory workers; (b) real estate taxes on factory; (c) electricity charge that includes the standard monthly charge plus a charge for each kilowatt hour; (d) commissions to salespersons; and (e) costs of hourly paid workers that provide substantial gains in efficiency when a few workers are added but gradually smaller gains in efficiency when more workers are added.
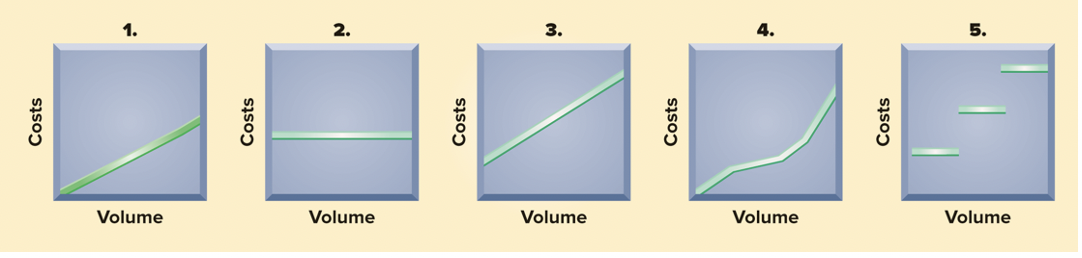
1. 2. 3. 4. 5. Costs Costs Costs Costs Costs Volume Volume Volume Volume Volume
Step by Step Solution
There are 3 Steps involved in it

Get step-by-step solutions from verified subject matter experts