

Question: Exercise #2 1. use the code given in below section Pie Charts examples 1 & 2. 2. Then write the R code create a 3D

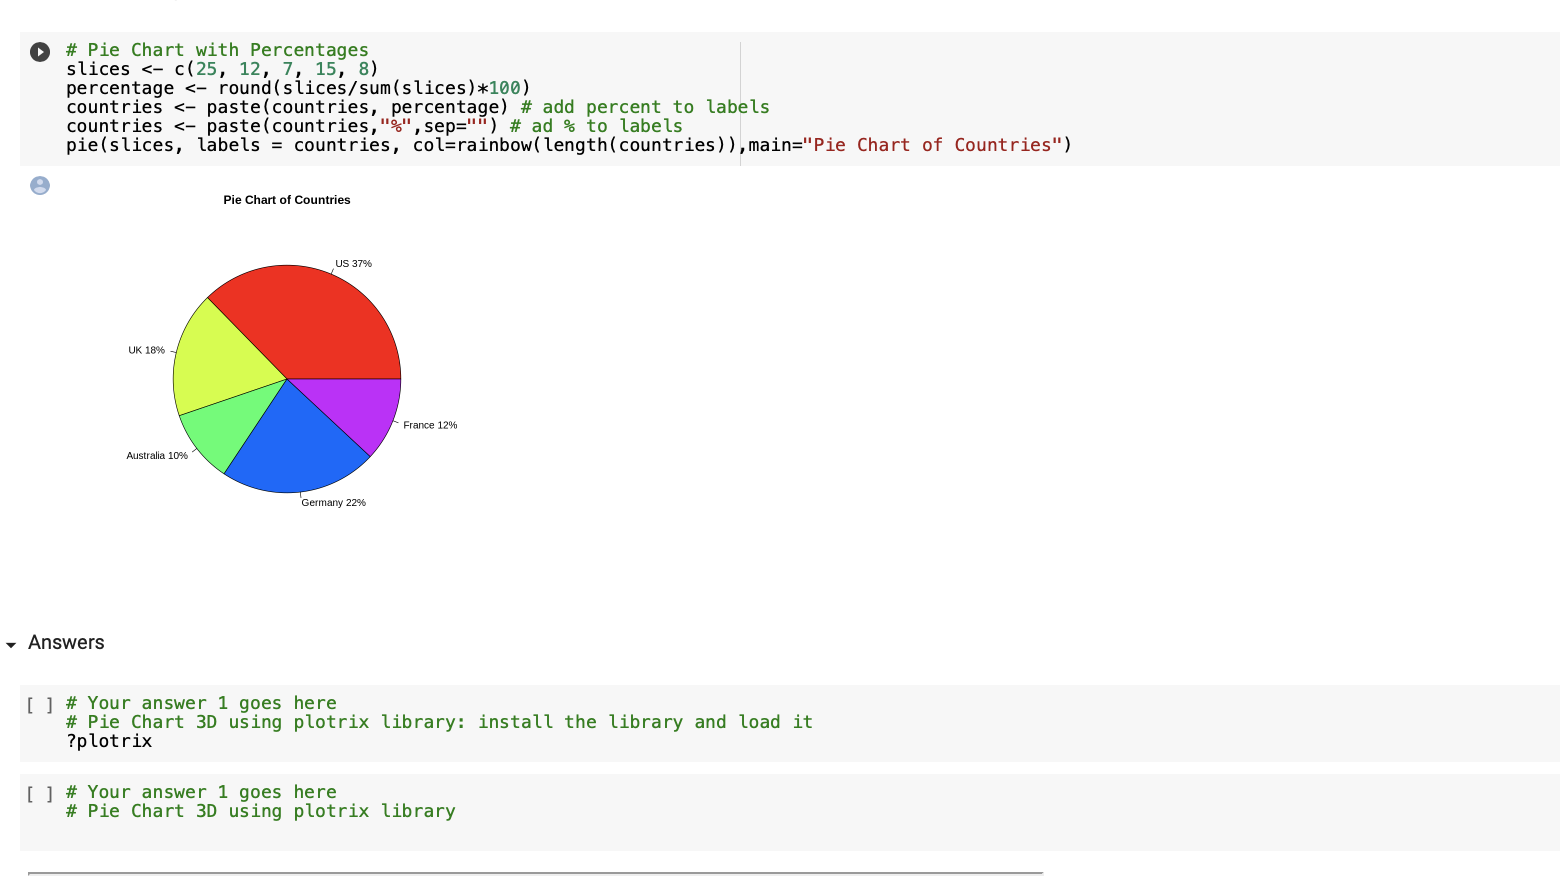
Exercise #2 1. use the code given in below section Pie Charts examples 1 & 2. 2. Then write the R code create a 3D pie chart for the same data slices/countries. Hint use plotrix Library. (need to install it then load it to be capable of using it) A # Pie Chart with Percentages slices
Step by Step Solution
There are 3 Steps involved in it
1 Expert Approved Answer
Step: 1 Unlock

Question Has Been Solved by an Expert!
Get step-by-step solutions from verified subject matter experts
Step: 2 Unlock
Step: 3 Unlock