

Question: Exercise 2 Exercise 2 Define t - vector t = Define y - vector Part ( a ) Plot results ( should have 3 plots
Exercise Exercise
Define tvector
Define vector
Part a
Plot results should have plots total
figure;
plot
title
figure;
plot
title Part b
Plot results as data points only and as data points with line.
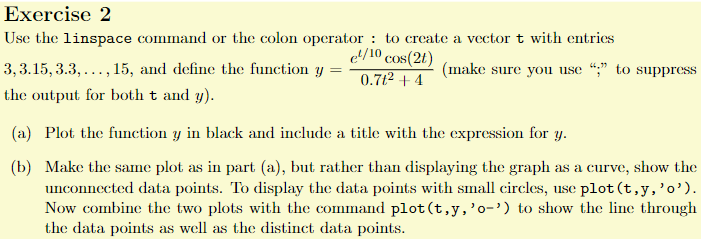
Use the linspace command or the colon operator : to create a vector with entries
dots, and define the function make sure you use ; to suppress
the output for both and
a Plot the function in black and include a title with the expression for
b Make the same plot as in part a but rather than displaying the graph as a curve, show the
unconnected data points. To display the data points with small circles, use plot tyo
Now combine the two plots with the command plot tyo to show the line through
the data points as well as the distinct data points.
Step by Step Solution
There are 3 Steps involved in it
1 Expert Approved Answer
Step: 1 Unlock

Question Has Been Solved by an Expert!
Get step-by-step solutions from verified subject matter experts
Step: 2 Unlock
Step: 3 Unlock