

Question: Exercise 2 Following is the key financial data: Ratio (% of Sales) Cost of goods sold Gross profits Selling expense Gen. & admin. expense Depreciation
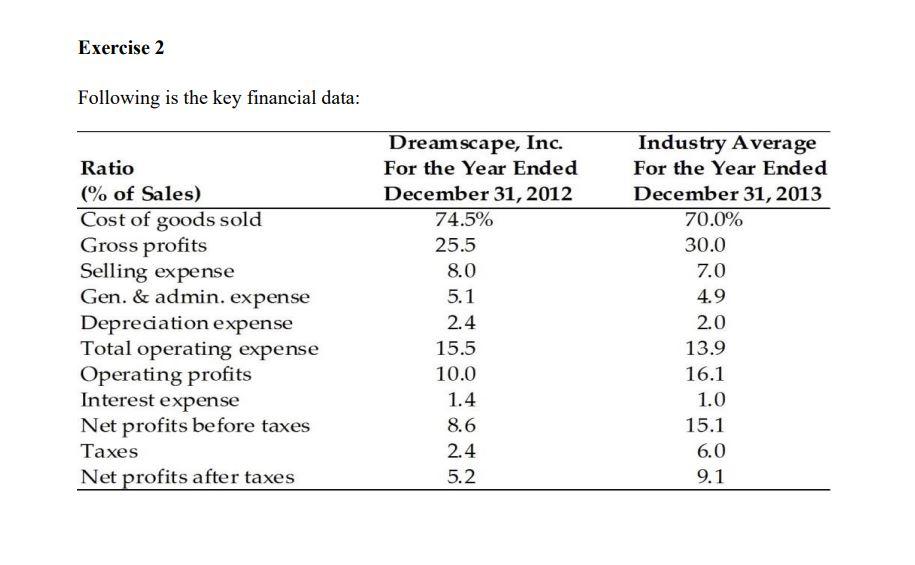
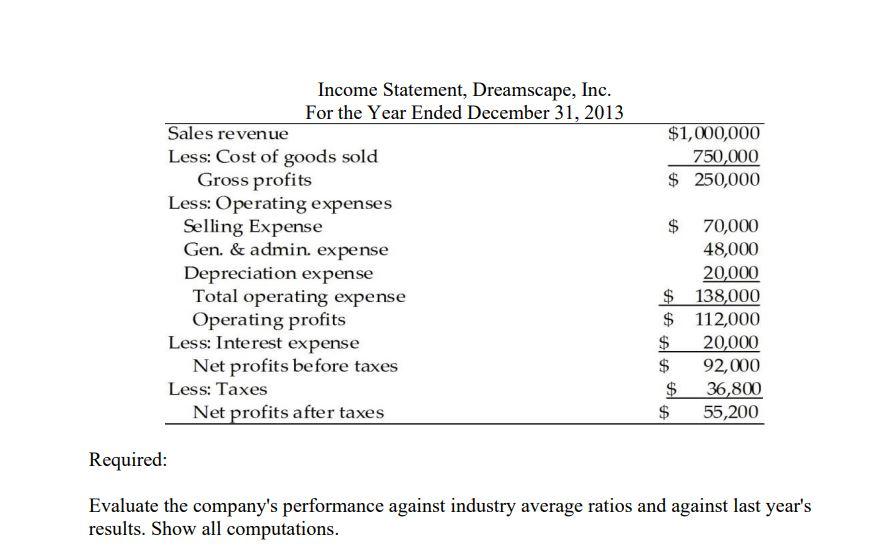
Exercise 2 Following is the key financial data: Ratio (% of Sales) Cost of goods sold Gross profits Selling expense Gen. & admin. expense Depreciation expense Total operating expense Operating profits Interest expense Net profits before taxes Taxes Net profits after taxes Dreamscape, Inc. For the Year Ended December 31, 2012 74.5% 25.5 8.0 5.1 2.4 15.5 10.0 1.4 8.6 2.4 5.2 Industry Average For the Year Ended December 31, 2013 70.0% 30.0 7.0 4.9 2.0 13.9 16.1 1.0 15.1 6.0 9.1 $1,000,000 750,000 $ 250,000 Income Statement, Dreamscape, Inc. For the Year Ended December 31, 2013 Sales revenue Less: Cost of goods sold Gross profits Less: Operating expenses Selling Expense Gen. & admin. expense Depreciation expense Total operating expense Operating profits Less: Interest expense Net profits before taxes Less: Taxes Net profits after taxes $ 70,000 48,000 20,000 $ 138,000 $ 112,000 $ 20,000 $ 92,000 $ 36,800 $ 55,200 Required: Evaluate the company's performance against industry average ratios and against last year's results. Show all computations
Step by Step Solution
There are 3 Steps involved in it

Get step-by-step solutions from verified subject matter experts