

Question: Exercise 2: Money Supply Consider a simple model like the one we studied in class, featuring three agents: a central bank, a representative private bank
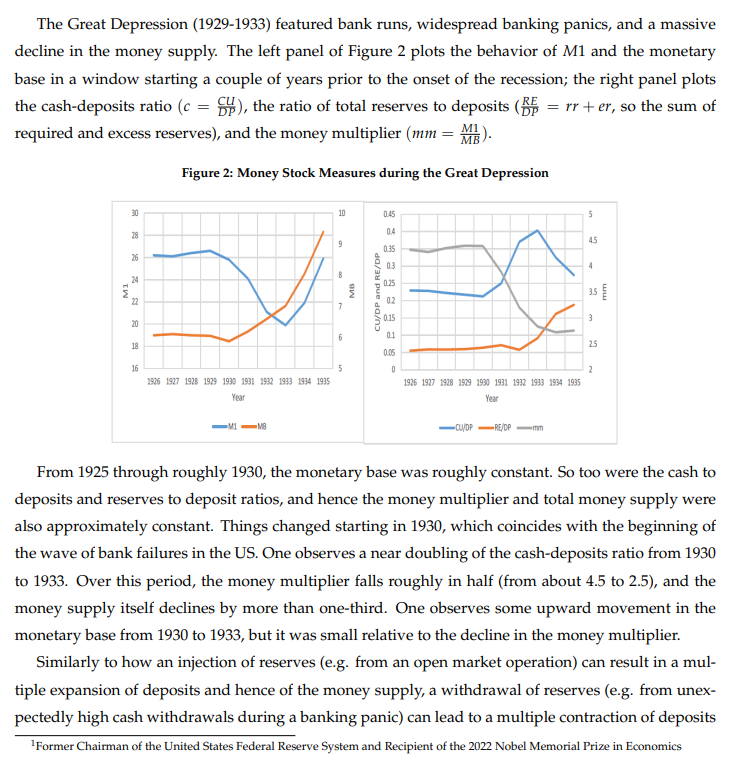


Exercise 2: Money Supply Consider a simple model like the one we studied in class, featuring three agents: a central bank, a representative private bank and a representative household. The private bank starts with $1000 in loans, $300 in government bonds (we will simply call these, securilfies) and $150 in reserves. On the liability side, the bank faces $1000 in deposits. The Central bank has $500 of securities while facing liabilities for $150 in reserves (the ones that the private bank has) and $250 in currency under circulation The household holds currency for $250 and has deposits at the private bank for $1000. It faces no liabilities. The reserves-to-deposit ratio that mandates the private bank's lending behavior is given by p = pg + pe = 0.1+ 005 = 0.15 = g:';;*;_ Where pz = 0.1 is the required reserve ratio (dictated by legal regulation) and pe = 0.05 is the excess reserve ratio, which means that the bank wants to hold slightly above the minimum requirement (so that it can successfully deal with both liquidity and credit risk). On the household side, the key parameter is y = ?h =02 Throughout this exercise, we will assume that both p and x remain fixed. a) (5 points) Write down the balance sheet (in T-account) for each of the three agents in this economy b) (10 points) Consider now an open market operation in which the central bank purchases from the private bank, $100 worth in securities, and pays by increasing the private bank's reserves in 100. Write down the three agents' balance sheet immediately after this operation (the new balance sheets should only reflect the operation between the central and the private bank. The household's balance sheet is actually unchanged). c) (10 points) Assuming that the private bank wishes to keep its reserve-to-depaosit ratio fixed and equal to g = 0.15 and also that the household wishes to keep its currency-to-money ratio fixed and equal to y = 0.2, write down the final balance sheet for each of the three agents after all the rounds of borrowing and lending that would follow from the open market operation (make sure to use the formulae that we derived in class) The Great Depression (1929-1933) featured bank runs, widespread banking panics, and a massive decline in the money supply. The left panel of Figure 2 plots the behavior of M1 and the monetary base in a window starng a couple of years prior to the onset of the recession; the right pane] p]nts the cash-deposits ratio {c' = %}, the ratio of total reserves to deposits (55 = rr + er, so the sum of M1 required and excess reserves), and the money multiplier (nm = ). Figure 2: Money Stock Measures during the Great Depression - 03 - LE B CU/DF and RESDP 4 105 1507 1928 195 1930 1%3% 150 1933 19 1935 1906 1917 1508 1509 1930 1931 1932 1933 1834 1935 Year Year hE e [LYIP e f[DP sy From 1925 through roughly 1930, the monetary base was roughly constant. So too were the cash to deposits and reserves to deposit ratios, and hence the money mu]l'iplier and total money supply were also approximately constant. Things changed starting in 1930, which coincides with the beginning of the wave of bank failures in the US. One observes a near doubling of the cash-deposits ratio from 1930 to 1933. Over this period, the money multiplier falls roughly in half (from about 4.5 to 2.5), and the money supply itself declines by more than one-third. One observes some upward movement in the monetary base from 1930 to 1933, but it was small relative to the decline in the money multiplier. Similarly to how an injection of reserves (e.g. from an open market operation) can result in a mul- ple expansion of deposits and hence of the money supp]y, a withdrawal of reserves (e.g. from unex- pectedly high cash withdrawals during a banking panic) can lead to a multiple contraction of deposits 'Former Chairman of the United States Federal Reserve System and Recipient of the 2022 Nobel Memorial Prize in Economics expansion of the Fed's balance sheet. First, it extended credit to financial institutions. Second, it bought large quantities of non-standard debt (both longer maturity Treasury securities and mortgage-related debt). In terms of these T=acounts, we can think about the Fed's non-standard interventions as taking three forms: a) Loans to institutions b) Purchases of loans (think of these loan purchases as mortgages) ) Purchases of longer term Treasury Securities To finance these purchases and allow its balance sheet to expand in size, the Fed simply created reserves and credited the reserve balance accounts of the financial institutions selling securities. We show the Fed's balance sheet expanding by $2.5 trillion, which is roughly consistent with the experience in the aftermath of the recession. This expansion of the balance sheet was financed by the creation of reserves. The sale of mortgage-related securities and longer term Treasury securities involves a change in the compo- sition of the banking system's assets: these assets decline in value and reserves increase by an equal amount. The addition of borrowings from the Fed increases the liability side of the balance sheet and is reflected in higher reserve balances. All told, the extraordinary measures resulted in an infusion of more than $2 trillion in reserves into the banking system (in both the data as well as in our stylized example). In theory, the infusion of reserves, albeit through non-standard means, could have an effect on the supply of money through the similar multiple deposit creation channel outlined earlier. Prior to the crisis, the banking system (in our stylized example) main- tained a reserve balance of about 10 percent. The injection of reserves significantly increases the reserve-deposit ratio, and in principal allows for the banking system to issue new loans and in the process create more deposits. In practice, this did not happen. Figure 4 plots the behavior of the money supply as measured by M1 and the monetary base in the left panel. In the right panel we plot the money multiplier, the cash-deposit ratio, and reserve-deposit ratio
Step by Step Solution
There are 3 Steps involved in it

Get step-by-step solutions from verified subject matter experts