

Question: Exercise 2 please, all necessary coding to create that graph import pandas as pd import numpy as np import plotly.graph We are going to be
Exercise please, all necessary coding to create that graph
import pandas as pd
import numpy as np
import plotly.graph
We are going to be using the "cars" dataset from seaborn. This includes information about many car types. Our goal is to better understand how
different factors influence the fuel economy of the vehicle.
#Load the mpg dataset from seaborn
import seaborn as sns
import seaborn as sns mpg snsloaddatasetmpg
Look at the columns of the dataset to understand the variables you will be working with.
mpghead
Exercise
cells hidden
Exercise
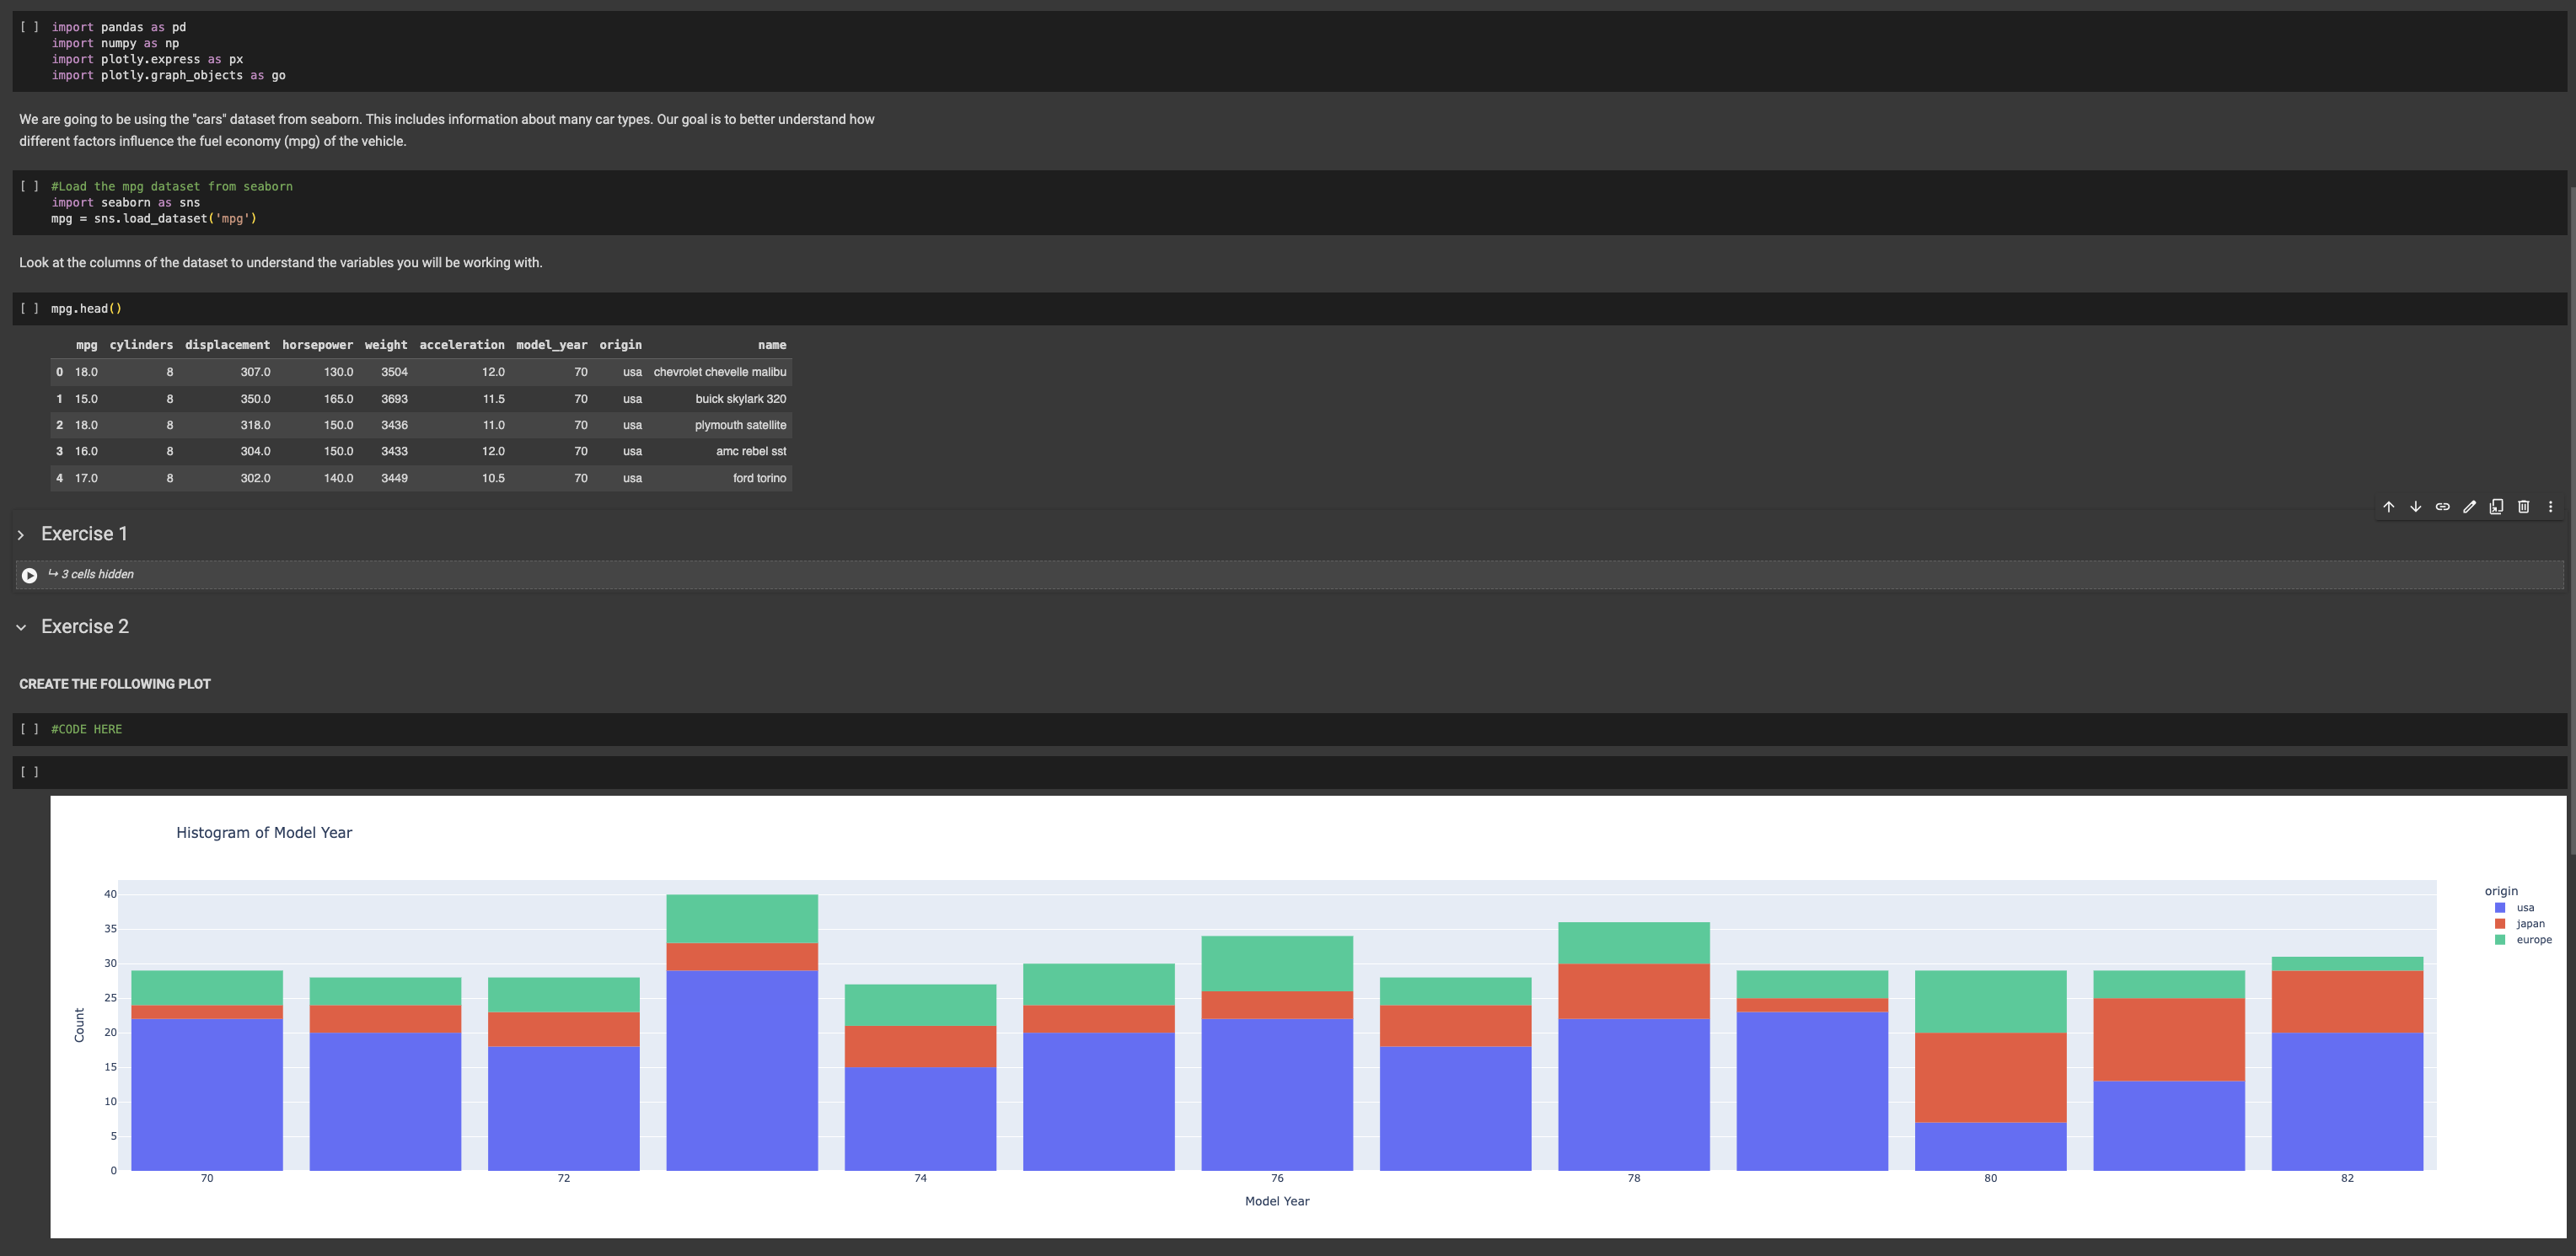
CREATE THE FOLLOWING PLOT
#CODE HERE
Step by Step Solution
There are 3 Steps involved in it
1 Expert Approved Answer
Step: 1 Unlock

Question Has Been Solved by an Expert!
Get step-by-step solutions from verified subject matter experts
Step: 2 Unlock
Step: 3 Unlock