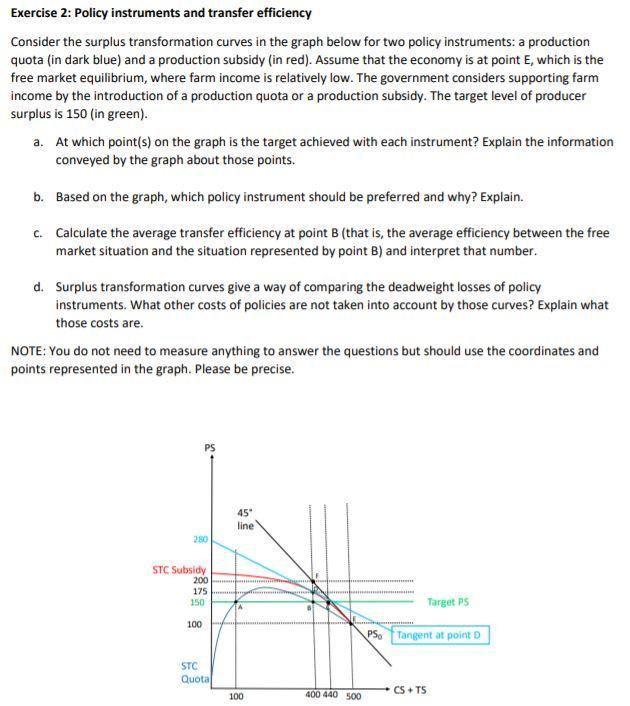
Question: Exercise 2: Policy instruments and transfer efficiency Consider the surplus transformation curves in the graph below for two policy instruments: a production quota (in dark

Exercise 2: Policy instruments and transfer

Exercise 2: Policy instruments and transfer efficiency Consider the surplus transformation curves in the graph below for two policy instruments: a production quota (in dark blue) and a production subsidy (in red). Assume that the economy is at point E, which is the free market equilibrium, where farm income is relatively low. The government considers supporting farm income by the introduction of a production quota or a production subsidy. The target level of producer surplus is 150 (in green). a. At which point(s) on the graph is the target achieved with each instrument? Explain the information conveyed by the graph about those points. b. Based on the graph, which policy instrument should be preferred and why? Explain. C. Calculate the average transfer efficiency at point B (that is, the average efficiency between the free market situation and the situation represented by point B) and interpret that number. d. Surplus transformation curves give a way of comparing the deadweight losses of policy instruments. What other costs of policies are not taken into account by those curves? Explain what those costs are. NOTE: You do not need to measure anything to answer the questions but should use the coordinates and points represented in the graph. Please be precise. 45" line 280 STC Subsidy 175 150 200 Target PS 100 PS. Tangent at point D STC Quotal 100 CS + TS 400 440 500

Step by Step Solution

There are 3 Steps involved in it

1 Expert Approved Answer
Step: 1 Unlock blur-text-image
Question Has Been Solved by an Expert!

Get step-by-step solutions from verified subject matter experts

Step: 2 Unlock
Step: 3 Unlock

Students Have Also Explored These Related General Management Questions!