

Question: Exercise 2. Prediction Intervals for SES Consider the data on the change in real GDP (GDP_change_2.xlsx) previously examined in Exercise Sheet 3 (Exercises 1 and
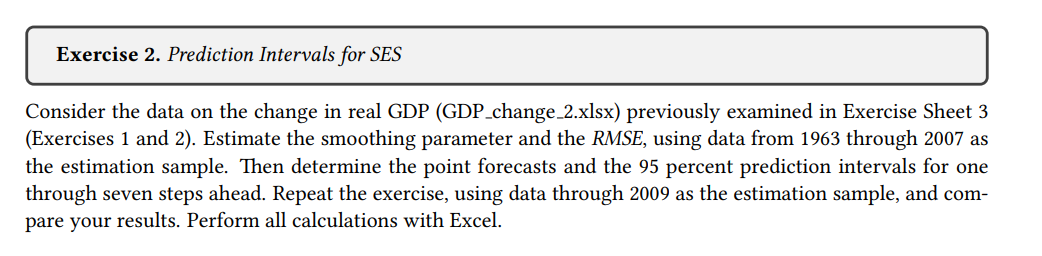
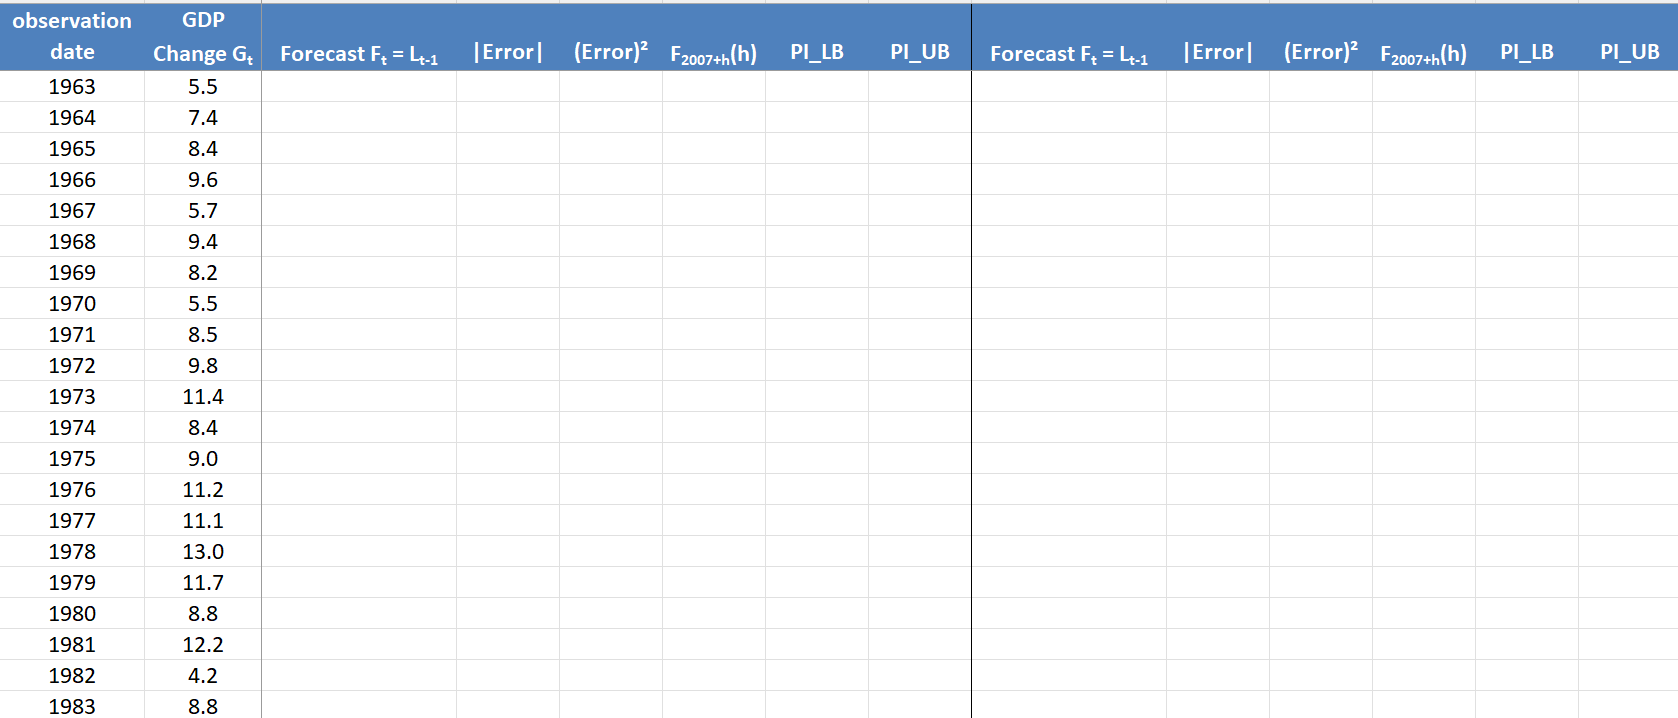
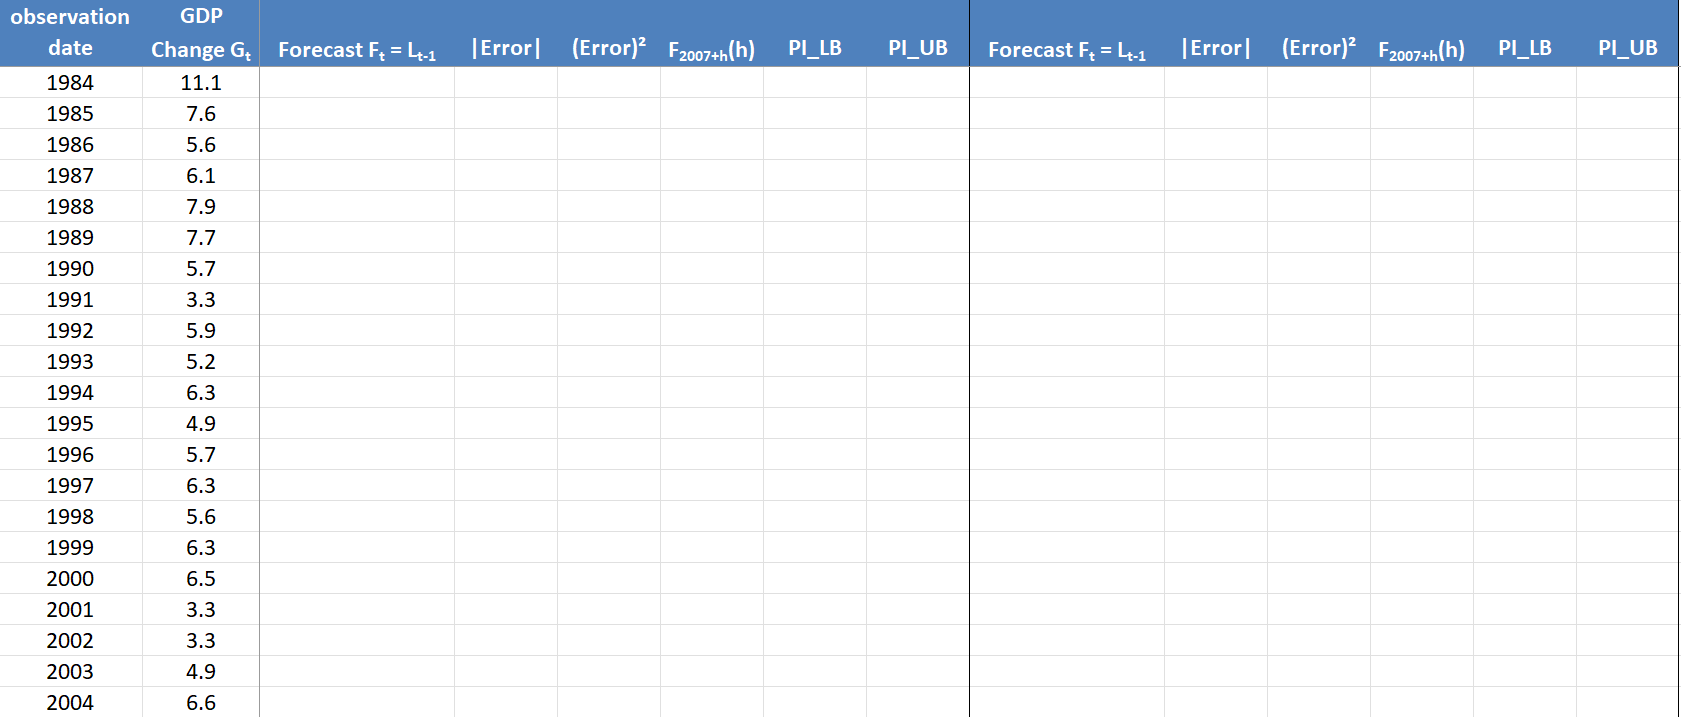
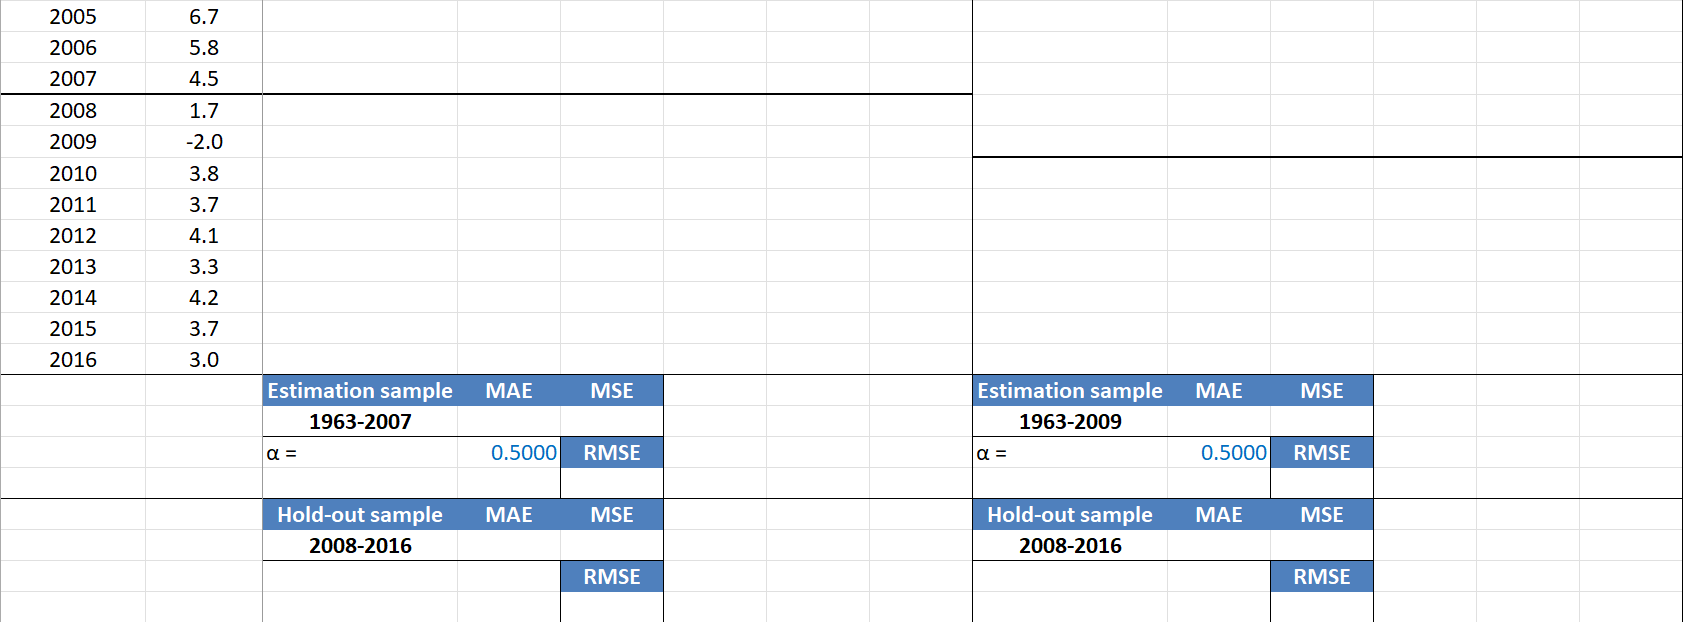
Exercise 2. Prediction Intervals for SES Consider the data on the change in real GDP (GDP_change_2.xlsx) previously examined in Exercise Sheet 3 (Exercises 1 and 2). Estimate the smoothing parameter and the RMSE, using data from 1963 through 2007 as the estimation sample. Then determine the point forecasts and the 95 percent prediction intervals for one through seven steps ahead. Repeat the exercise, using data through 2009 as the estimation sample, and com- pare your results. Perform all calculations with Excel. observation GDP date Change G Forecast F = L-1 1963 5.5 1964 7.4 1965 8.4 1966 9.6 1967 5.7 1968 9.4 1969 8.2 1970 5.5 1971 8.5 1972 9.8 1973 11.4 1974 8.4 1975 9.0 1976 11.2 1977 11.1 1978 13.0 1979 11.7 1980 8.8 1981 12.2 1982 4.2 1983 8.8 Error (Error) F2007+h(h) PI_LB PI_UB Forecast F = L-1 Error (Error) F2007+h(h) PI_LB PI_UB observation GDP date 1984 1985 1986 1987 1988 1989 1990 1991 1992 1993 1994 1995 1996 1997 1998 1999 2000 2001 2002 2003 2004 Change G Forecast F = 4-1 11.1 7.6 5.6 6.1 7.9 7.7 5.7 3.3 5.9 5.2 6.3 4.9 5.7 6.3 5.6 6.3 6.5 3.3 3.3 4.9 6.6 |Error (Error) F2007+h(h) PI_LB PI_UB Forecast F = 4.1 |Error (Error) F2007+h(h) PI_LB PI_UB 2005 2006 2007 2008 2009 2010 2011 2012 2013 2014 2015 2016 6.7 5.8 4.5 1.7 -2.0 3.8 3.7 4.1 3.3 4.2 3.7 3.0 Estimation sample MAE 1963-2007 0.5000 Hold-out sample MAE 2008-2016 MSE RMSE MSE RMSE Estimation sample 1963-2009 = Hold-out sample 2008-2016 MAE 0.5000 MAE MSE RMSE MSE RMSE Exercise 2. Prediction Intervals for SES Consider the data on the change in real GDP (GDP_change_2.xlsx) previously examined in Exercise Sheet 3 (Exercises 1 and 2). Estimate the smoothing parameter and the RMSE, using data from 1963 through 2007 as the estimation sample. Then determine the point forecasts and the 95 percent prediction intervals for one through seven steps ahead. Repeat the exercise, using data through 2009 as the estimation sample, and com- pare your results. Perform all calculations with Excel. observation GDP date Change G Forecast F = L-1 1963 5.5 1964 7.4 1965 8.4 1966 9.6 1967 5.7 1968 9.4 1969 8.2 1970 5.5 1971 8.5 1972 9.8 1973 11.4 1974 8.4 1975 9.0 1976 11.2 1977 11.1 1978 13.0 1979 11.7 1980 8.8 1981 12.2 1982 4.2 1983 8.8 Error (Error) F2007+h(h) PI_LB PI_UB Forecast F = L-1 Error (Error) F2007+h(h) PI_LB PI_UB observation GDP date 1984 1985 1986 1987 1988 1989 1990 1991 1992 1993 1994 1995 1996 1997 1998 1999 2000 2001 2002 2003 2004 Change G Forecast F = 4-1 11.1 7.6 5.6 6.1 7.9 7.7 5.7 3.3 5.9 5.2 6.3 4.9 5.7 6.3 5.6 6.3 6.5 3.3 3.3 4.9 6.6 |Error (Error) F2007+h(h) PI_LB PI_UB Forecast F = 4.1 |Error (Error) F2007+h(h) PI_LB PI_UB 2005 2006 2007 2008 2009 2010 2011 2012 2013 2014 2015 2016 6.7 5.8 4.5 1.7 -2.0 3.8 3.7 4.1 3.3 4.2 3.7 3.0 Estimation sample MAE 1963-2007 0.5000 Hold-out sample MAE 2008-2016 MSE RMSE MSE RMSE Estimation sample 1963-2009 = Hold-out sample 2008-2016 MAE 0.5000 MAE MSE RMSE MSE RMSE
Step by Step Solution
There are 3 Steps involved in it

Get step-by-step solutions from verified subject matter experts