

Question: Exercise 2: Table given below shows the supply and demand schedules for used copies of the seventh edition of Economics Textbook. Go through the table
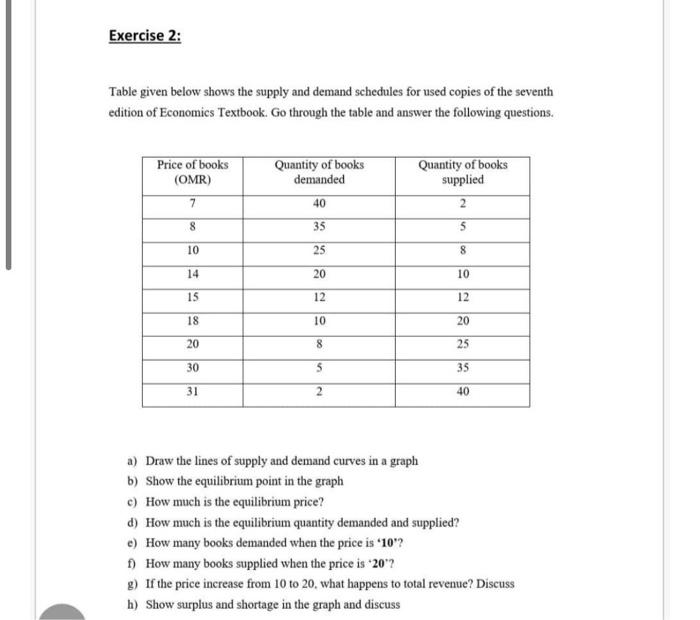
Exercise 2: Table given below shows the supply and demand schedules for used copies of the seventh edition of Economics Textbook. Go through the table and answer the following questions. Price of books (OMR) Quantity of books demanded Quantity of books supplied 7 40 2 8 35 $ 10 25 8 14 20 10 15 12 12 18 10 20 20 8 25 30 5 35 31 2 40 a) Draw the lines of supply and demand curves in a graph b) Show the equilibrium point in the graph c) How much is the equilibrium price? d) How much is the equilibrium quantity demanded and supplied? e) How many books demanded when the price is '10"? 1) How many books supplied when the price is "20"? g) If the price increase from 10 to 20, what happens to total revenue? Discuss h) Show surplus and shortage in the graph and discuss
Step by Step Solution
There are 3 Steps involved in it

Get step-by-step solutions from verified subject matter experts