

Question: Exercise 2: Using the wheel sensor data presented in Table 1 , determine the total dis- tance travelled, the displacement, and the average velocity, along
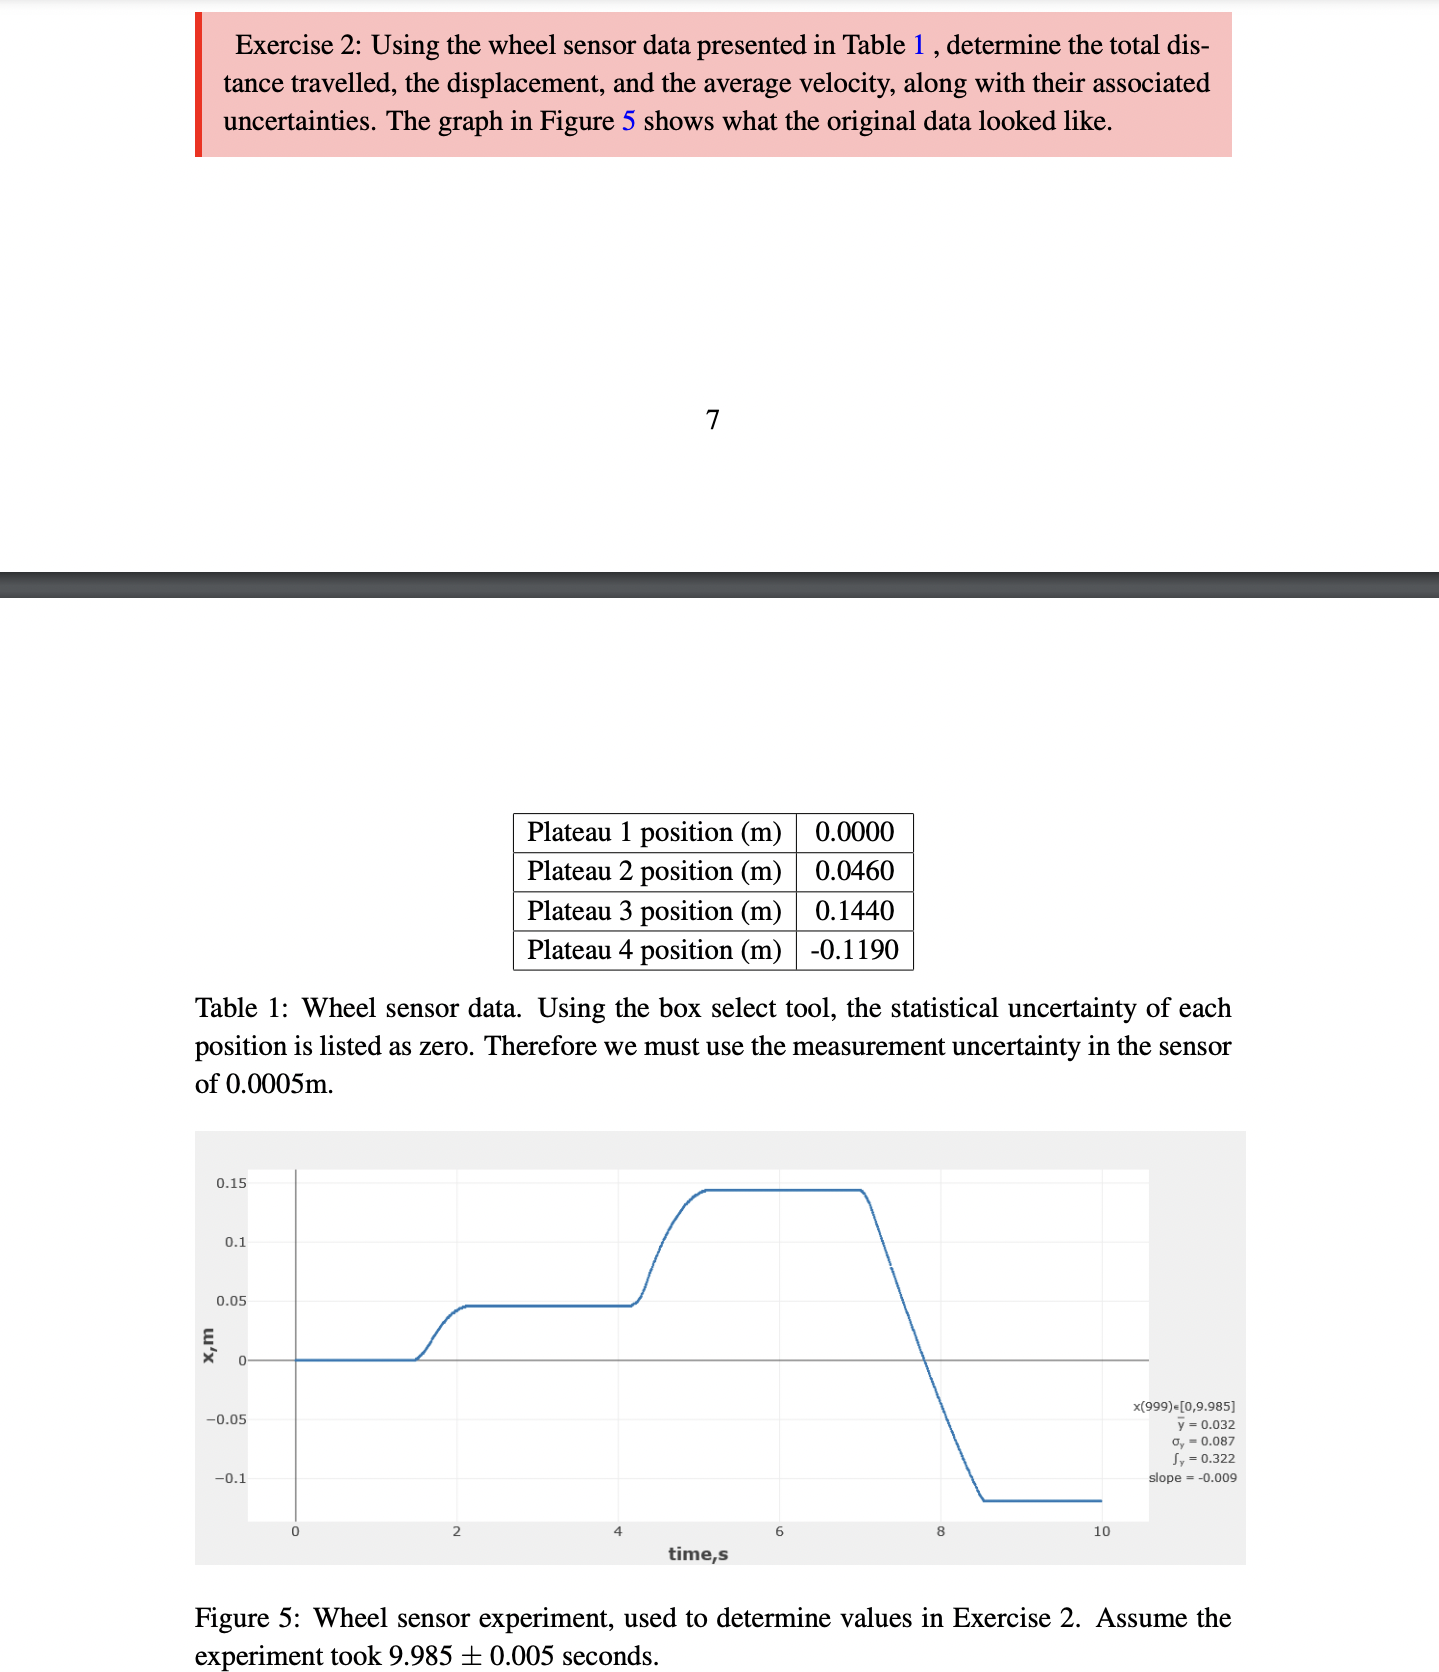
Exercise 2: Using the wheel sensor data presented in Table 1 , determine the total dis- tance travelled, the displacement, and the average velocity, along with their associated uncertainties. The graph in Figure 5 shows what the original data looked like. Plateau 1 position (111) 0.0000 Plateau 2 position (m) 0.0460 Plateau 3 position (111) 0.1440 Plateau 4 position (m) -O.1190 Table 1: Wheel sensor data. Using the box select tool, the statistical uncertainty of each position is listed as zero. Therefore we must use the measurement uncertainty in the sensor of 0.0005m. 0.15 0.1 0.05 D.DS 0.1 time,s 10 x(999)e[0,9.985] it = 0.032 a, = 0 037 1.. = 0.322 slope = 0009 Figure 5: Wheel sensor experiment, used to determine values in Exercise 2. Assume the experiment took 9.985 :I: 0.005 seconds
Step by Step Solution
There are 3 Steps involved in it

Get step-by-step solutions from verified subject matter experts