

Question: EXERCISE 20.4: CALCULATING NOMINAL GDP FROM RAW DATA The following data shows the quantities of output a hypothetical economy produced in 2002,2005 and 2010, and
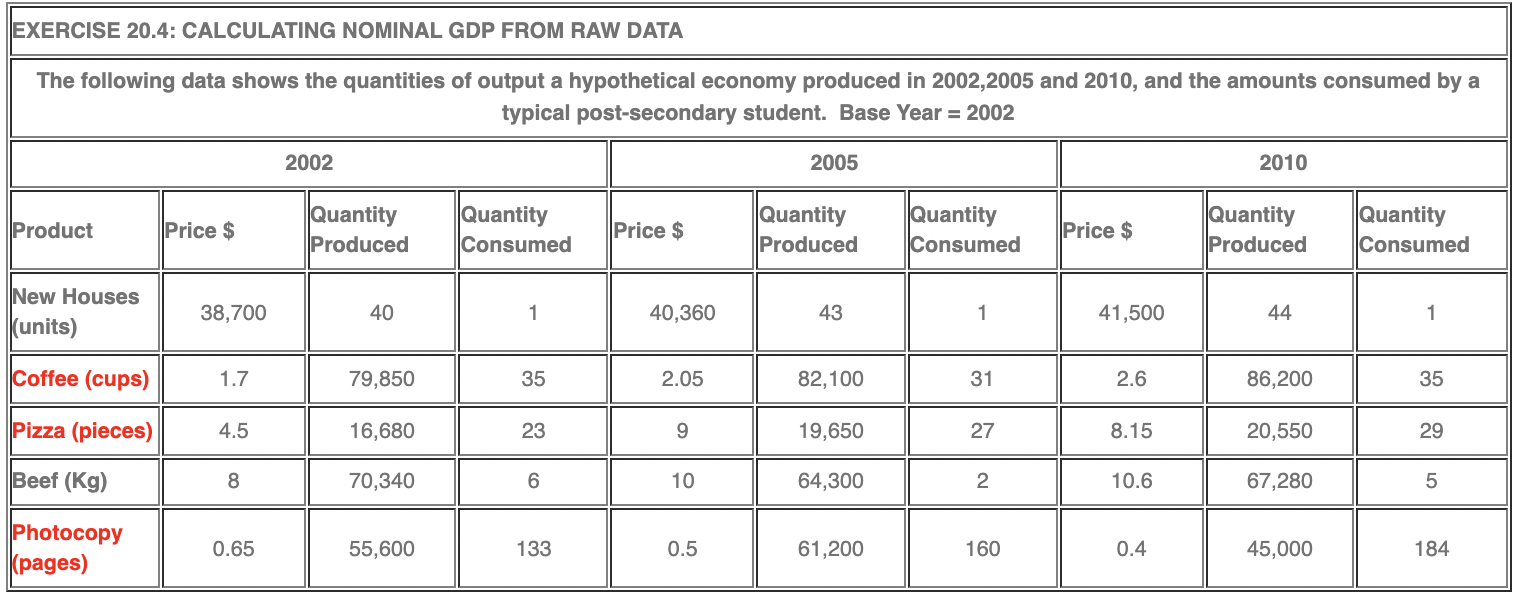
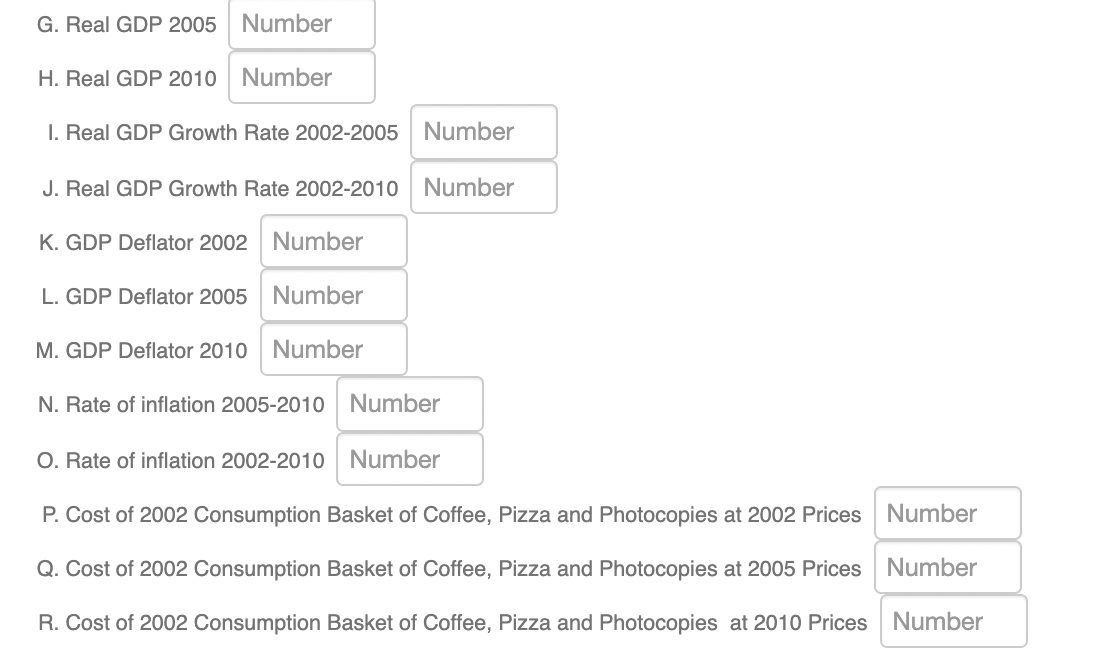
EXERCISE 20.4: CALCULATING NOMINAL GDP FROM RAW DATA The following data shows the quantities of output a hypothetical economy produced in 2002,2005 and 2010, and the amounts consumed by a typical post-secondary student. Base Year = 2002 2002 2005 2010 Quantity Quantity Quantity Quantity Quantity Quantity Product Price $ Price $ |Price $ Produced Consumed Produced Consumed Produced Consumed New Houses 38,700 40 40,360 43 41,500 44 (units) Coffee (cups) 1.7 79,850 35 2.05 82, 100 31 2.6 86,200 35 Pizza (pieces) 4.5 16,680 23 9 19,650 27 8.15 20,550 29 Beef (Kg) 8 70,340 6 10 64,300 2 10.6 67,280 5 Photocopy 0.65 55,600 133 0.5 61,200 160 0.4 45,000 184 (pages)G. Real GDP 2005 Number H. Real GDP 2010 Number I. Real GDP Growth Rate 2002-2005 Number J. Real GDP Growth Rate 2002-2010 Number K. GDP Deflator 2002 Number L. GDP Deflator 2005 Number M. GDP Deflator 2010 Number N. Rate of inflation 2005-2010 Number O. Rate of inflation 2002-2010 Number P. Cost of 2002 Consumption Basket of Coffee, Pizza and Photocopies at 2002 Prices Number Q. Cost of 2002 Consumption Basket of Coffee, Pizza and Photocopies at 2005 Prices Number R. Cost of 2002 Consumption Basket of Coffee, Pizza and Photocopies at 2010 Prices Number
Step by Step Solution
There are 3 Steps involved in it

Get step-by-step solutions from verified subject matter experts