

Question: Exercise 22-19 The Ferrell Transportation Company uses a responsibility reporting system to measure the performance of its three investment centers: Planes, Taxis, and Limos. Segment
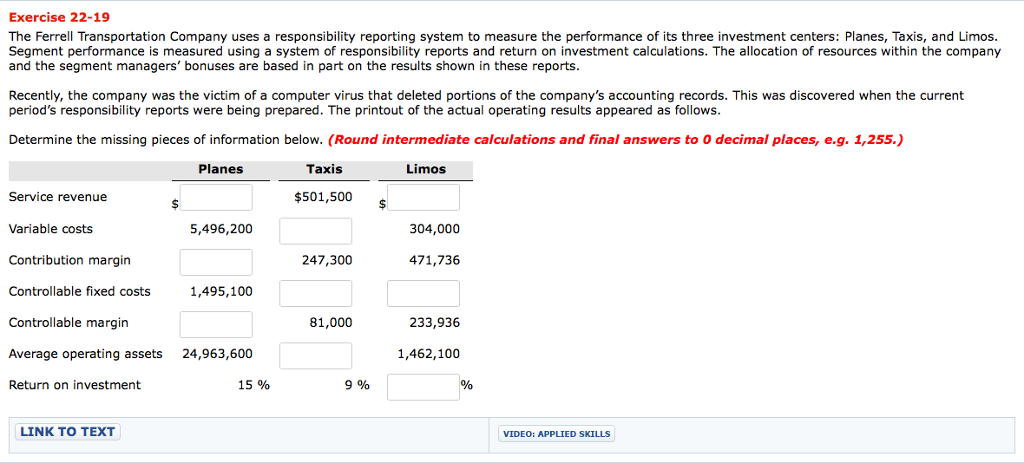
Exercise 22-19 The Ferrell Transportation Company uses a responsibility reporting system to measure the performance of its three investment centers: Planes, Taxis, and Limos. Segment performance is measured using a system of responsibility reports and return on investment calculations. The allocation of resources within the company and the segment managers' bonuses are based in part on the results shown in these reports Recently, the company was the victim of a computer virus that deleted portions of the company's accounting records. This was discovered when the current period's responsibility reports were being prepared. The printout of the actual operating results appeared as follows Determine the missing pieces of information below. (Round intermediate calculations and final answers to o decimal places, e.g. 1,255.) Planes Taxis Limos Service revenue Variable costs Contribution margin Controllable fixed costs Controllable margin Average operating assets Return on investment $501,500 5,496,200 304,000 247,300 471,736 1,495,100 81,000 233,936 24,963,600 1,462,100 15% 9% LINK TO TEXT VIDEO: APPLIED SKILLS Exercise 22-19 The Ferrell Transportation Company uses a responsibility reporting system to measure the performance of its three investment centers: Planes, Taxis, and Limos. Segment performance is measured using a system of responsibility reports and return on investment calculations. The allocation of resources within the company and the segment managers' bonuses are based in part on the results shown in these reports Recently, the company was the victim of a computer virus that deleted portions of the company's accounting records. This was discovered when the current period's responsibility reports were being prepared. The printout of the actual operating results appeared as follows Determine the missing pieces of information below. (Round intermediate calculations and final answers to o decimal places, e.g. 1,255.) Planes Taxis Limos Service revenue Variable costs Contribution margin Controllable fixed costs Controllable margin Average operating assets Return on investment $501,500 5,496,200 304,000 247,300 471,736 1,495,100 81,000 233,936 24,963,600 1,462,100 15% 9% LINK TO TEXT VIDEO: APPLIED SKILLS
Step by Step Solution
There are 3 Steps involved in it

Get step-by-step solutions from verified subject matter experts