

Question: Exercise 3 (10 marks) The article Optimization of Medium Composition for Lipase Production by Candida rugosa NCIM 3462 Using Response Surface Methodology describes a
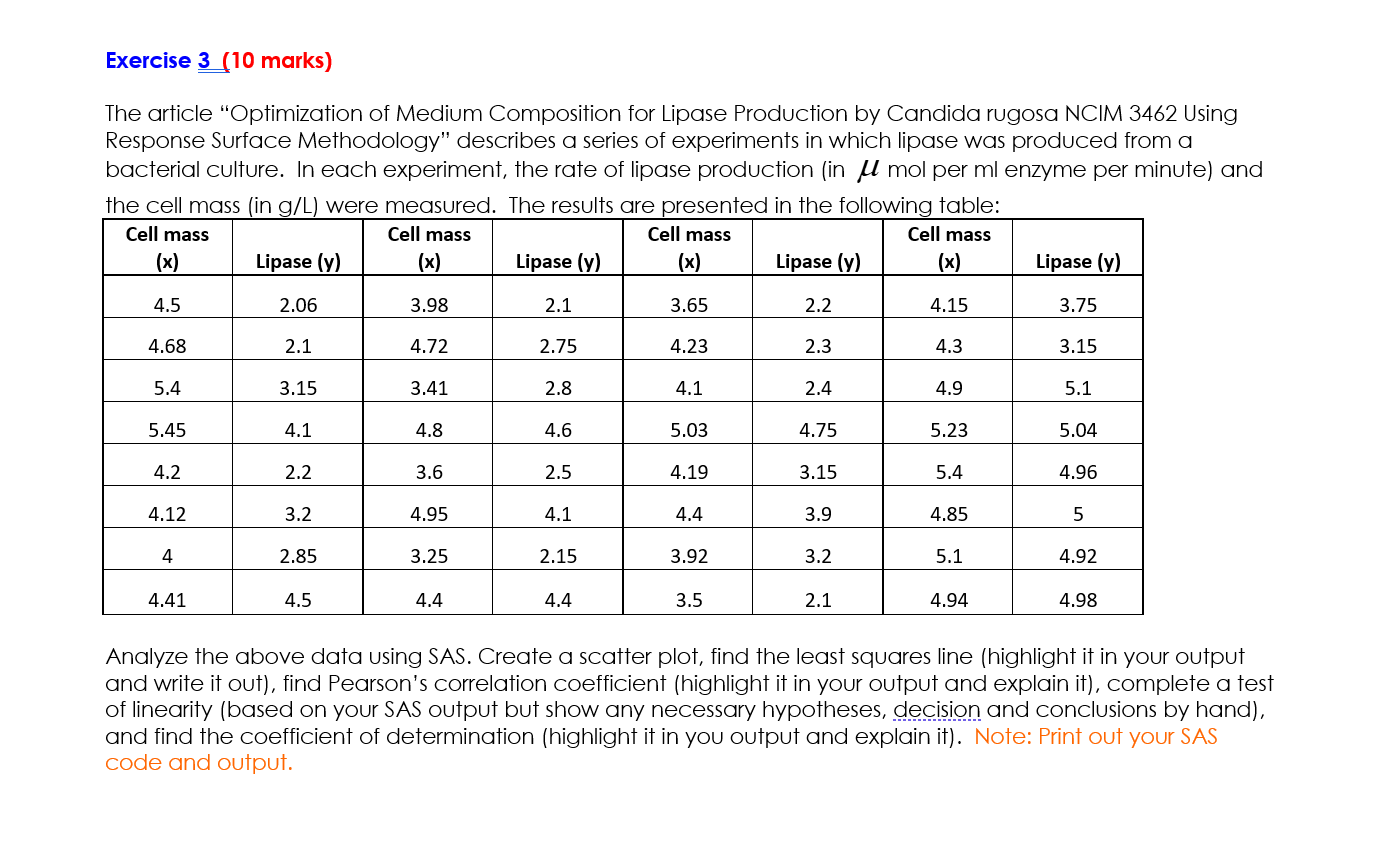
Exercise 3 (10 marks) The article "Optimization of Medium Composition for Lipase Production by Candida rugosa NCIM 3462 Using Response Surface Methodology" describes a series of experiments in which lipase was produced from a bacterial culture. In each experiment, the rate of lipase production (in mol per ml enzyme per minute) and the cell mass (in g/L) were measured. The results are presented in the following table: Cell mass Cell mass Cell mass Cell mass (x) Lipase (y) (x) Lipase (y) (x) Lipase (y) (x) Lipase (y) 4.5 2.06 3.98 2.1 3.65 2.2 4.15 3.75 4.68 2.1 4.72 2.75 4.23 2.3 4.3 3.15 5.4 3.15 3.41 2.8 4.1 2.4 4.9 5.1 5.45 4.1 4.8 4.6 5.03 4.75 5.23 5.04 4.2 2.2 3.6 2.5 4.19 3.15 5.4 4.96 4.12 3.2 4.95 4.1 4.4 3.9 4.85 5 4 2.85 3.25 2.15 3.92 3.2 5.1 4.92 4.41 4.5 4.4 4.4 3.5 2.1 4.94 4.98 Analyze the above data using SAS. Create a scatter plot, find the least squares line (highlight it in your output and write it out), find Pearson's correlation coefficient (highlight it in your output and explain it), complete a test of linearity (based on your SAS output but show any necessary hypotheses, decision and conclusions by hand), and find the coefficient of determination (highlight it in you output and explain it). Note: Print out your SAS code and output.
Step by Step Solution
There are 3 Steps involved in it

Get step-by-step solutions from verified subject matter experts