

Question: Exercise 3 (10 points) Background readings Chapter 2 The table below shows annual returns (%) for 3 asset classes. Annual returns (%) for 3
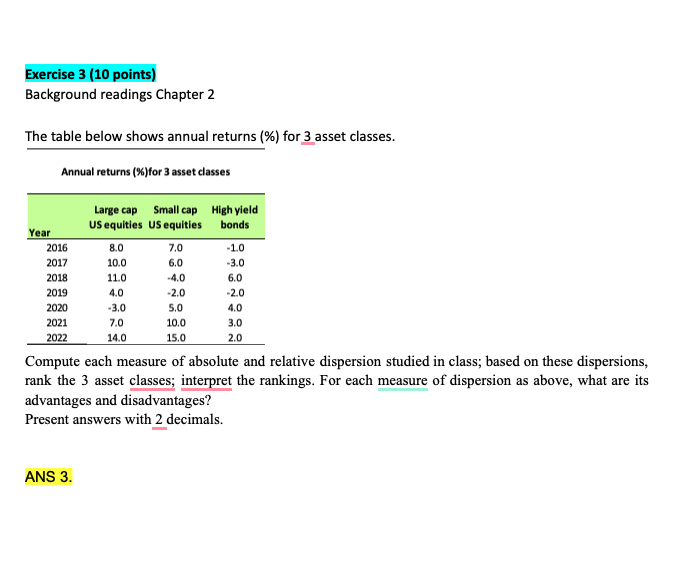
Exercise 3 (10 points) Background readings Chapter 2 The table below shows annual returns (%) for 3 asset classes. Annual returns (%) for 3 asset classes Large cap Small cap High yield US equities US equities bonds Year 2016 8.0 7.0 -1.0 2017 10.0 6.0 -3.0 2018 11.0 -4.0 6.0 2019 4.0 -2.0 -2.0 2020 -3.0 5.0 4.0 2021 7.0 10.0 3.0 2022 14.0 15.0 2.0 Compute each measure of absolute and relative dispersion studied in class; based on these dispersions, rank the 3 asset classes; interpret the rankings. For each measure of dispersion as above, what are its advantages and disadvantages? Present answers with 2 decimals. ANS 3.
Step by Step Solution
There are 3 Steps involved in it

Get step-by-step solutions from verified subject matter experts