

Question: Exercise 3 . 2 0 ( Static ) METHODS AND APPLICATIONS Table 3 . 3 gives spending data for the football programs at the 1
Exercise Static METHODS AND APPLICATIONS
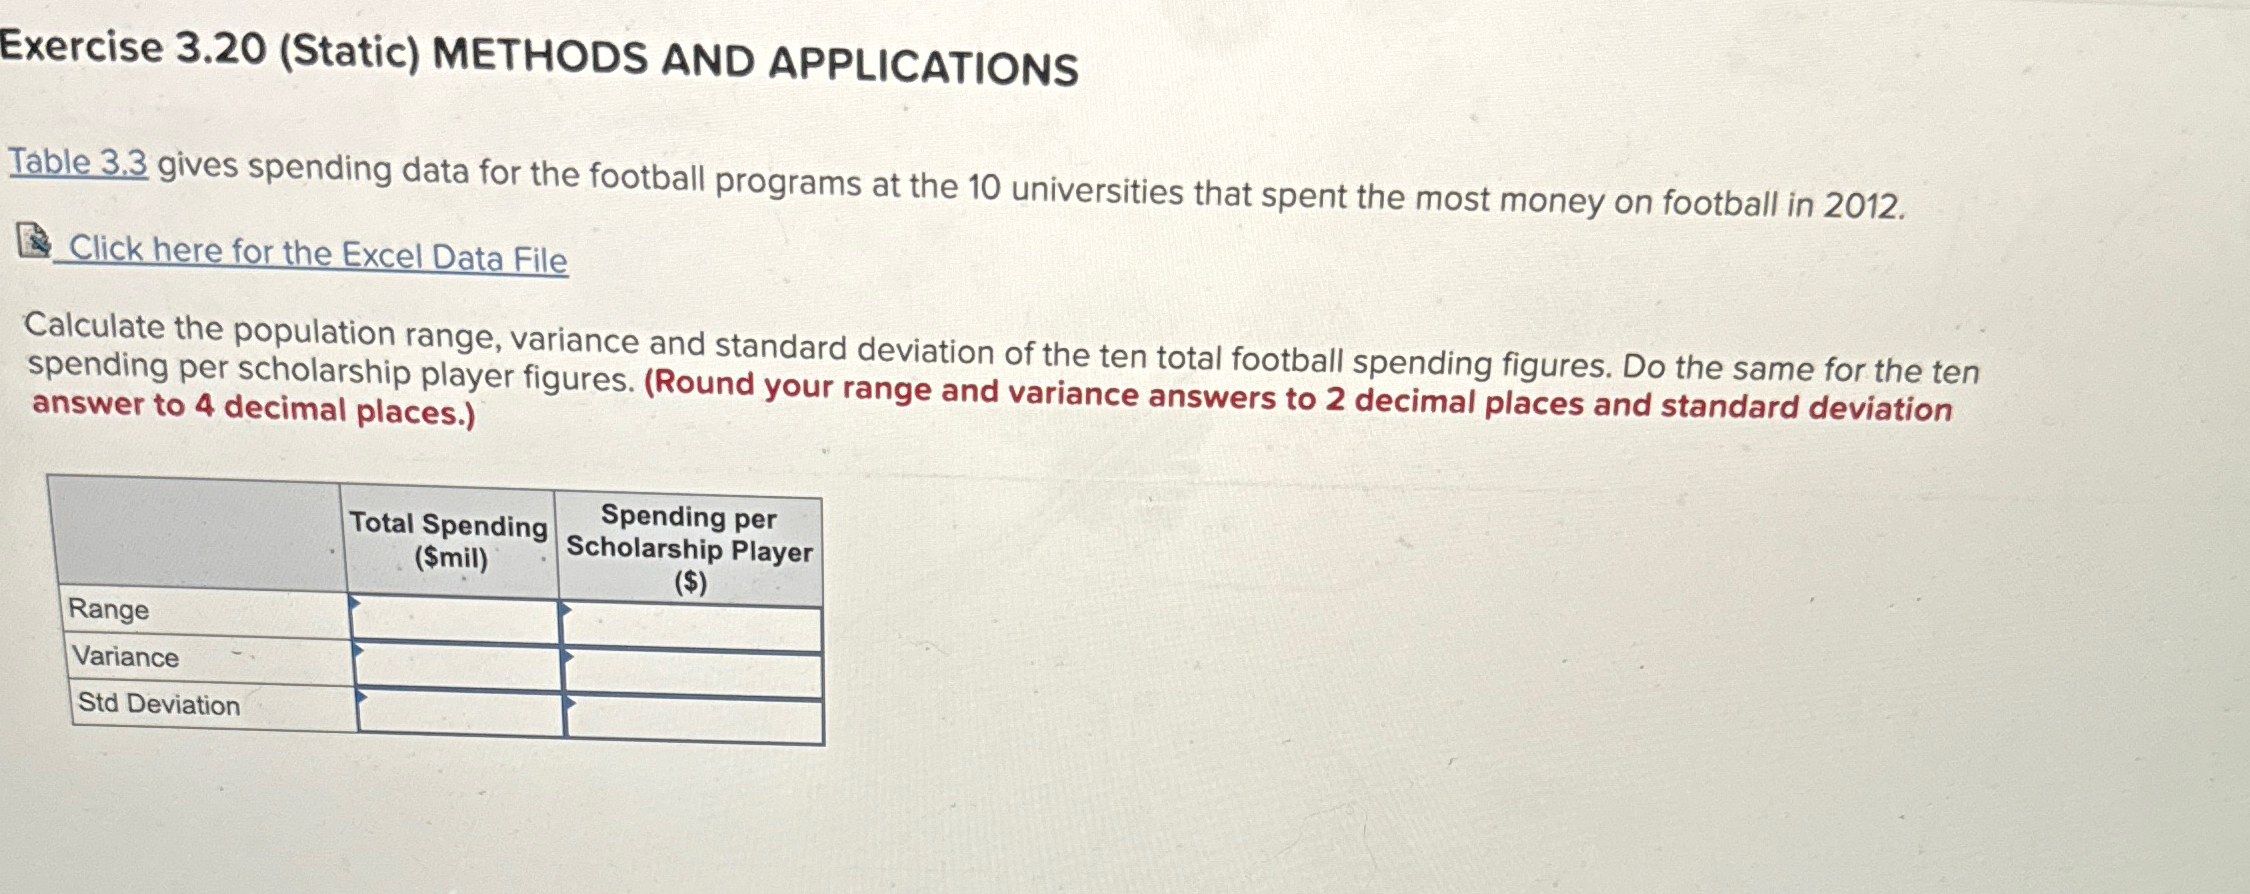
Table gives spending data for the football programs at the universities that spent the most money on football in
Click here for the Excel Data File
Calculate the population range, variance and standard deviation of the ten total football spending figures. Do the same for the ten spending per scholarship player figures. Round your range and variance answers to decimal places and standard deviation answer to decimal places.
tabletableTotal Spending$miltableSpending perScholarship Player$RangeVarianceStd Deviation,,
Step by Step Solution
There are 3 Steps involved in it
1 Expert Approved Answer
Step: 1 Unlock

Question Has Been Solved by an Expert!
Get step-by-step solutions from verified subject matter experts
Step: 2 Unlock
Step: 3 Unlock