

Question: Exercise 3 : A frequent source of clutter in data visualization comes from unnecessary graph elements: borders, gridlines, data markers, and the like. See the
Exercise :
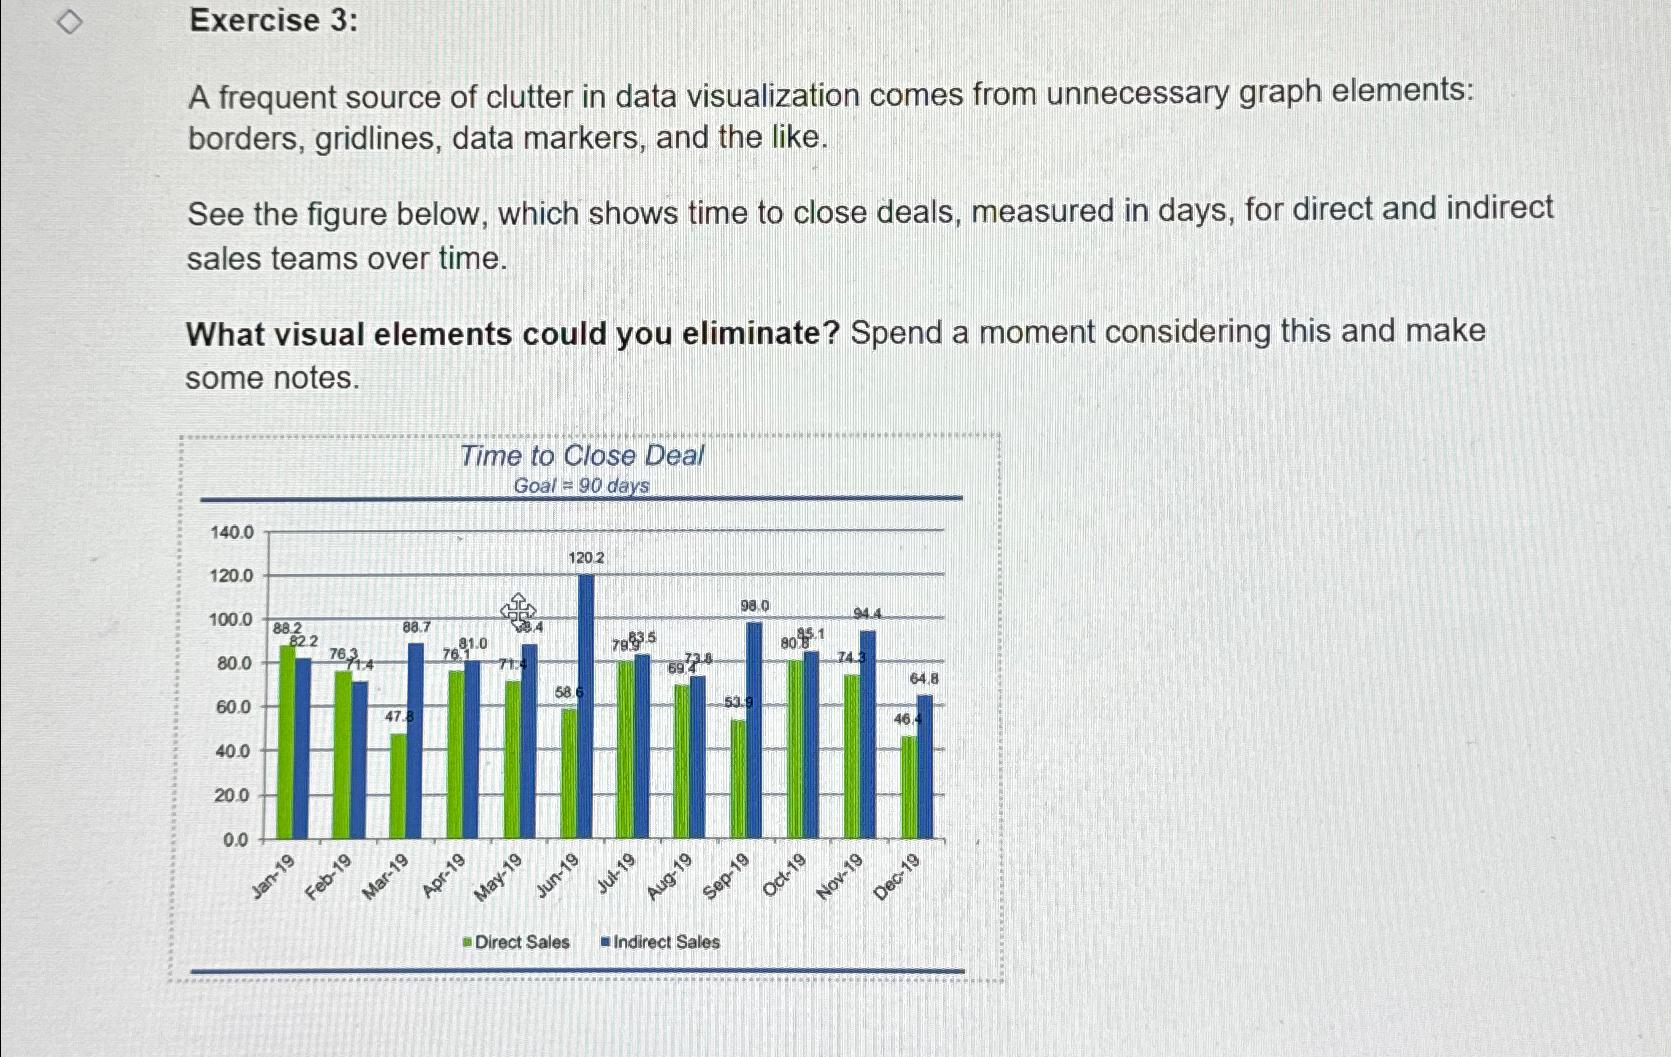
A frequent source of clutter in data visualization comes from unnecessary graph elements: borders, gridlines, data markers, and the like.
See the figure below, which shows time to close deals, measured in days, for direct and indirect sales teams over time.
What visual elements could you eliminate? Spend a moment considering this and make some notes.
Step by Step Solution
There are 3 Steps involved in it
1 Expert Approved Answer
Step: 1 Unlock

Question Has Been Solved by an Expert!
Get step-by-step solutions from verified subject matter experts
Step: 2 Unlock
Step: 3 Unlock