

Question: Exercise 3 Complete the following table: Quantity Price Total Average Marginal Total Marginal Total Cost Cost Cost Revenue Revenue Profile P200 145 180 175 AON
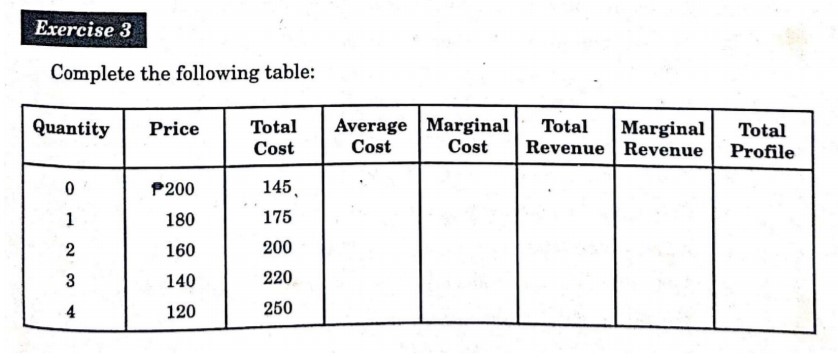
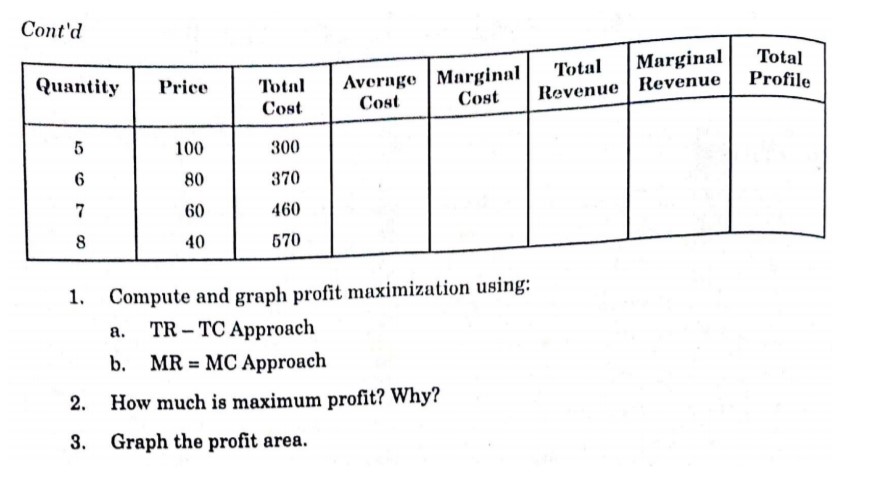
Exercise 3 Complete the following table: Quantity Price Total Average Marginal Total Marginal Total Cost Cost Cost Revenue Revenue Profile P200 145 180 175 AON HO 160 200 140 220 120 250Cont'd Marginal Total Quantity Price Average Total Total Marginal Cost Cost Cost Revenue Revenue Profile 100 300 80 370 60 460 40 570 1. Compute and graph profit maximization using: a. TR - TC Approach b. MR = MC Approach 2. How much is maximum profit? Why? 3. Graph the profit area
Step by Step Solution
There are 3 Steps involved in it
1 Expert Approved Answer
Step: 1 Unlock

Question Has Been Solved by an Expert!
Get step-by-step solutions from verified subject matter experts
Step: 2 Unlock
Step: 3 Unlock