

Question: Exercise 3: For our data analysis below, we will use the crime dataset that appears in Statistical Methods for Social Sciences, Third Edition by Alan
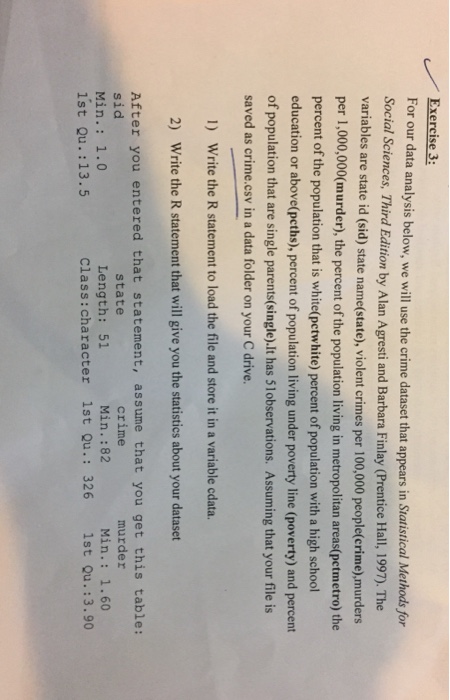
Exercise 3: For our data analysis below, we will use the crime dataset that appears in Statistical Methods for Social Sciences, Third Edition by Alan Agresti and Barbara Finlay (Prentice Hal, 1997). The variables are state id (sid) state name(state), violent crimes per 100,000 people(crime),murders per 1,000,000(murder), the percent of the population living in metropolitan areas(petmetro) the percent of the population that is white(petwhite) percent of population with a high school education or above(peths), percent of population living under poverty line (poverty) and percent of population that are single parents(single).It has 51observations. Assuming that your file is saved as crime.csv in a data folder on your C drive 1) Write the R statement to load the file and store it in a variable cdata. 2) Write the R statement that will give you the statistics about your dataset After you entered that statement, assume that you get this table: sid Min.: 1.0 1st Qu. :13.5 crime Min.:82 murder state Length: 51 Min.: 1.60 1st Qu. :3.90 Class:character 1st Qu.: 326 Exercise 3: For our data analysis below, we will use the crime dataset that appears in Statistical Methods for Social Sciences, Third Edition by Alan Agresti and Barbara Finlay (Prentice Hal, 1997). The variables are state id (sid) state name(state), violent crimes per 100,000 people(crime),murders per 1,000,000(murder), the percent of the population living in metropolitan areas(petmetro) the percent of the population that is white(petwhite) percent of population with a high school education or above(peths), percent of population living under poverty line (poverty) and percent of population that are single parents(single).It has 51observations. Assuming that your file is saved as crime.csv in a data folder on your C drive 1) Write the R statement to load the file and store it in a variable cdata. 2) Write the R statement that will give you the statistics about your dataset After you entered that statement, assume that you get this table: sid Min.: 1.0 1st Qu. :13.5 crime Min.:82 murder state Length: 51 Min.: 1.60 1st Qu. :3.90 Class:character 1st Qu.: 326
Step by Step Solution
There are 3 Steps involved in it

Get step-by-step solutions from verified subject matter experts