

Question: Exercise 3: Parametric analysis of the EMG using MATLAB Develop a Matlab program to perform the following analysis 1. Load the EMG signal that you
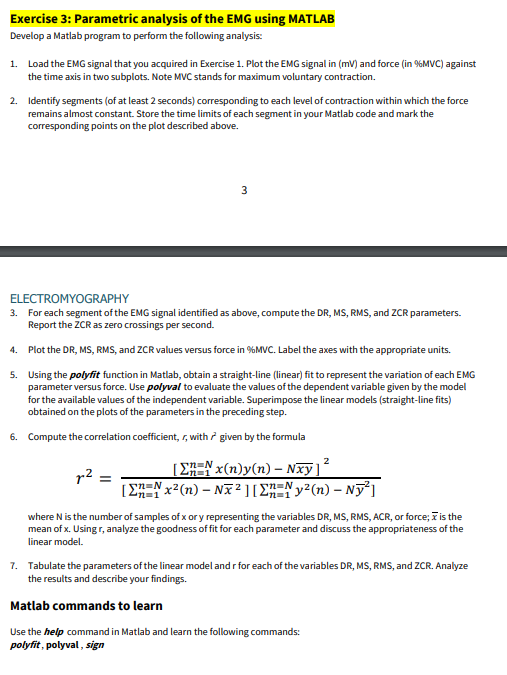
Exercise 3: Parametric analysis of the EMG using MATLAB Develop a Matlab program to perform the following analysis 1. Load the EMG signal that you acquired in Exercise 1. Plot the EMG signal in (mv) and force (in %MVC) against the time axis in two subplots. Note MVC stands for maximum voluntary contraction. 2. Identify segments (of at least 2 seconds) corresponding to each level of contraction within which the force remains almost constant. Store the time limits of each segment in your Matlab code and mark the corresponding points on the plot described above. 3 ELECTROMYOGRAPHY 3. For each segment of the EMG signal identified as above, compute the DR, MS, RMS, and ZCR parameters. Report the CCR as zero crossings per second. 4. Plot the DR, MS, RMS, and ZCR values versus force in %MVC. Label the axes with the appropriate units. 5. Using the polyfit function in Matlab, obtain a straight-line (linear) fit to represent the variation of each EMG parameter versus force. Use polyval to evaluate the values of the dependent variable given by the model for the available values of the independent variable. Superimpose the linear models (straight-line fits) obtained on the plots of the parameters in the preceding step. 6. Compute the correlation coefficient, 5, with 7 given by the formula 2 r2 [En= x(n)y(n) - Nxy] [EN=Nx?(n) - Na2][EN=Ny?(n) - Ny?) where N is the number of samples of x or y representing the variables DR, MS, RMS, ACR, or force; 7 is the mean of x. Usingr, analyze the goodness of fit for each parameter and discuss the appropriateness of the linear model. 7. Tabulate the parameters of the linear model andr for each of the variables DR, MS, RMS, and ZCR. Analyze the results and describe your findings. Matlab commands to learn Use the help command in Matlab and learn the following commands: polyfit, polyval, sign Exercise 3: Parametric analysis of the EMG using MATLAB Develop a Matlab program to perform the following analysis 1. Load the EMG signal that you acquired in Exercise 1. Plot the EMG signal in (mv) and force (in %MVC) against the time axis in two subplots. Note MVC stands for maximum voluntary contraction. 2. Identify segments (of at least 2 seconds) corresponding to each level of contraction within which the force remains almost constant. Store the time limits of each segment in your Matlab code and mark the corresponding points on the plot described above. 3 ELECTROMYOGRAPHY 3. For each segment of the EMG signal identified as above, compute the DR, MS, RMS, and ZCR parameters. Report the CCR as zero crossings per second. 4. Plot the DR, MS, RMS, and ZCR values versus force in %MVC. Label the axes with the appropriate units. 5. Using the polyfit function in Matlab, obtain a straight-line (linear) fit to represent the variation of each EMG parameter versus force. Use polyval to evaluate the values of the dependent variable given by the model for the available values of the independent variable. Superimpose the linear models (straight-line fits) obtained on the plots of the parameters in the preceding step. 6. Compute the correlation coefficient, 5, with 7 given by the formula 2 r2 [En= x(n)y(n) - Nxy] [EN=Nx?(n) - Na2][EN=Ny?(n) - Ny?) where N is the number of samples of x or y representing the variables DR, MS, RMS, ACR, or force; 7 is the mean of x. Usingr, analyze the goodness of fit for each parameter and discuss the appropriateness of the linear model. 7. Tabulate the parameters of the linear model andr for each of the variables DR, MS, RMS, and ZCR. Analyze the results and describe your findings. Matlab commands to learn Use the help command in Matlab and learn the following commands: polyfit, polyval, sign
Step by Step Solution
There are 3 Steps involved in it

Get step-by-step solutions from verified subject matter experts