

Question: Exercise 3.1. Create a MATLAB script to reproduce Figure 3.1. Ex- periment with other values of N. Describe what you see. Near the jump discontinuity
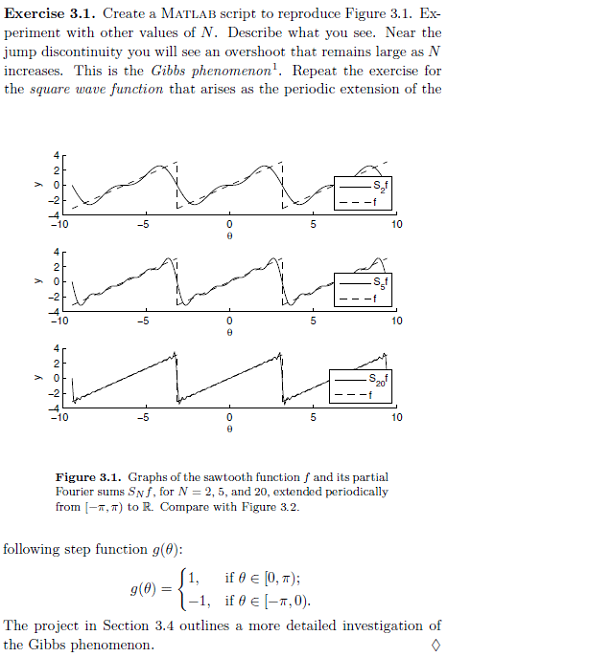
Exercise 3.1. Create a MATLAB script to reproduce Figure 3.1. Ex- periment with other values of N. Describe what you see. Near the jump discontinuity you will see an overshoot that remains large as N increases. This is the Gibbs phenomenon! Repeat the exercise for the square wave function that arises as the periodic extension of the 2. 0 -10 -5 0 5 10 2 0 -S3 -10 10 4 2 0 -10 -5 0 5 10 Figure 3.1. Graphs of the sawtooth function and its partial Fourier sums Snf, for N = 2, 5, and 20, extended periodically from (-1,T) to R. Compare with Figure 3.2. following step function g(6): if @ [0,7); g@) -1, if 0 (-1,0). The project in Section 3.4 outlines a more detailed investigation of the Gibbs phenomenon. Exercise 3.1. Create a MATLAB script to reproduce Figure 3.1. Ex- periment with other values of N. Describe what you see. Near the jump discontinuity you will see an overshoot that remains large as N increases. This is the Gibbs phenomenon! Repeat the exercise for the square wave function that arises as the periodic extension of the 2. 0 -10 -5 0 5 10 2 0 -S3 -10 10 4 2 0 -10 -5 0 5 10 Figure 3.1. Graphs of the sawtooth function and its partial Fourier sums Snf, for N = 2, 5, and 20, extended periodically from (-1,T) to R. Compare with Figure 3.2. following step function g(6): if @ [0,7); g@) -1, if 0 (-1,0). The project in Section 3.4 outlines a more detailed investigation of the Gibbs phenomenon
Step by Step Solution
There are 3 Steps involved in it

Get step-by-step solutions from verified subject matter experts