

Question: Exercise 311: U-Chart Problem 1 (5 Points): Indiana Paint Products (IPP) recently began selling its signature Redbird Red paint which it manufactures in two can
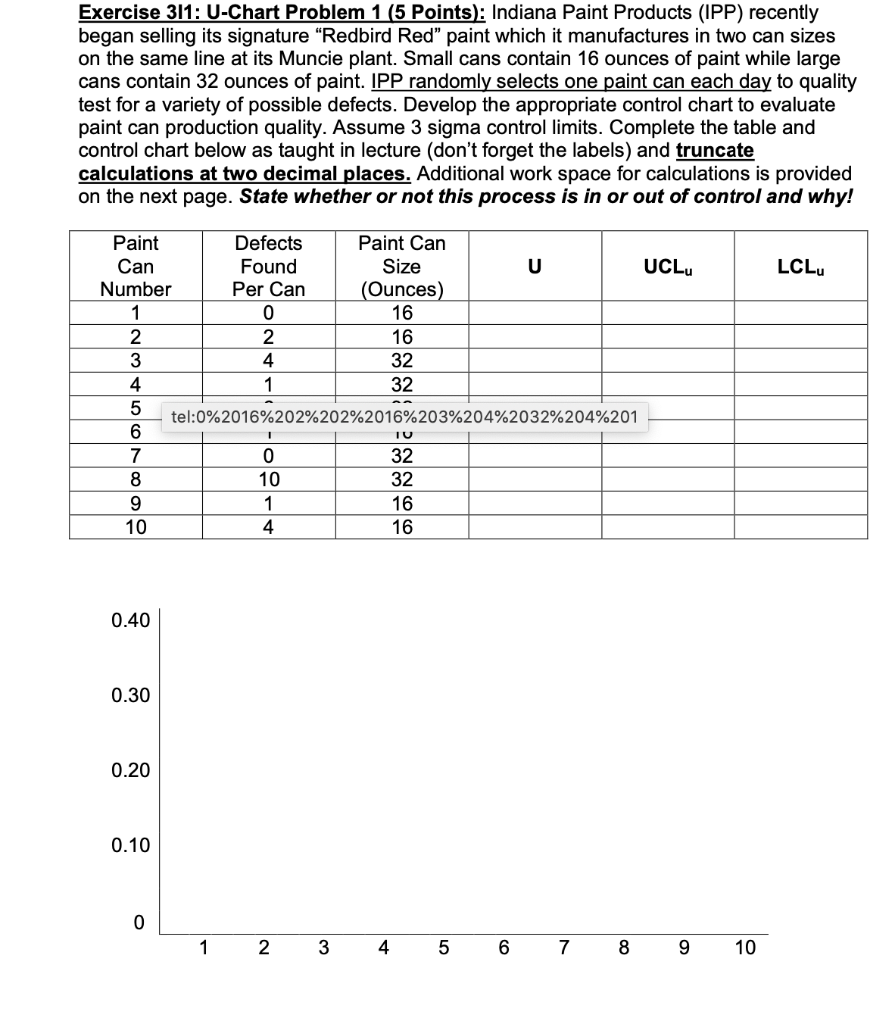
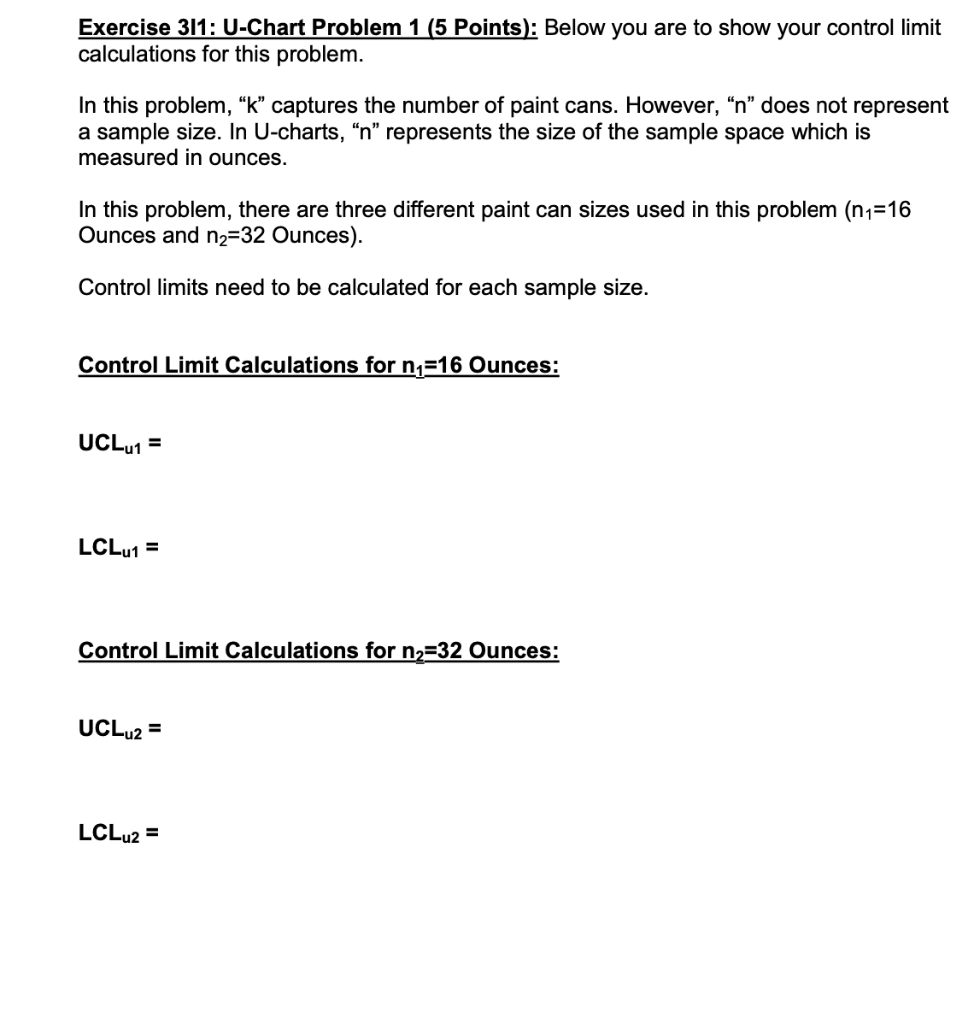
Exercise 311: U-Chart Problem 1 (5 Points): Indiana Paint Products (IPP) recently began selling its signature Redbird Red" paint which it manufactures in two can sizes on the same line at its Muncie plant. Small cans contain 16 ounces of paint while large cans contain 32 ounces of paint. IPP randomly selects one paint can each day to quality test for a variety of possible defects. Develop the appropriate control chart to evaluate paint can production quality. Assume 3 sigma control limits. Complete the table and control chart below as taught in lecture (don't forget the labels) and truncate calculations at two decimal places. Additional work space for calculations is provided on the next page. State whether or not this process is in or out of control and why! LCL 1 Paint Defects Paint Can Can Found Size U UCL Number Per Can (Ounces) 0 16 2 2 16 3 4 32 4 1 32 5 tel:0%2016%202%202%2016%203%204%2032%204%201 6 7 0 32 8 10 32 9 1 16 10 4 16 1 1 0.40 0.30 0.20 0.10 0 1 2 4 5 6 7 8 9 10 Exercise 311: U-Chart Problem 1 (5 Points): Below you are to show your control limit calculations for this problem. In this problem, k captures the number of paint cans. However, n does not represent a sample size. In U-charts, n represents the size of the sample space which is measured in ounces. In this problem, there are three different paint can sizes used in this problem (n1=16 Ounces and n2=32 Ounces). Control limits need to be calculated for each sample size. Control Limit Calculations for n=16 Ounces: UCLu1 = LCLu1 = Control Limit Calculations for n2=32 Ounces: UCLU2 = LCLu2 = Exercise 311: U-Chart Problem 1 (5 Points): Indiana Paint Products (IPP) recently began selling its signature Redbird Red" paint which it manufactures in two can sizes on the same line at its Muncie plant. Small cans contain 16 ounces of paint while large cans contain 32 ounces of paint. IPP randomly selects one paint can each day to quality test for a variety of possible defects. Develop the appropriate control chart to evaluate paint can production quality. Assume 3 sigma control limits. Complete the table and control chart below as taught in lecture (don't forget the labels) and truncate calculations at two decimal places. Additional work space for calculations is provided on the next page. State whether or not this process is in or out of control and why! LCL 1 Paint Defects Paint Can Can Found Size U UCL Number Per Can (Ounces) 0 16 2 2 16 3 4 32 4 1 32 5 tel:0%2016%202%202%2016%203%204%2032%204%201 6 7 0 32 8 10 32 9 1 16 10 4 16 1 1 0.40 0.30 0.20 0.10 0 1 2 4 5 6 7 8 9 10 Exercise 311: U-Chart Problem 1 (5 Points): Below you are to show your control limit calculations for this problem. In this problem, k captures the number of paint cans. However, n does not represent a sample size. In U-charts, n represents the size of the sample space which is measured in ounces. In this problem, there are three different paint can sizes used in this problem (n1=16 Ounces and n2=32 Ounces). Control limits need to be calculated for each sample size. Control Limit Calculations for n=16 Ounces: UCLu1 = LCLu1 = Control Limit Calculations for n2=32 Ounces: UCLU2 = LCLu2 =
Step by Step Solution
There are 3 Steps involved in it

Get step-by-step solutions from verified subject matter experts