

Question: EXERCISE 3-2 Scattergram Analysis [LO2 Q1 The data below have been taken from the cost records of the Halifax General Hospital. The data relate to
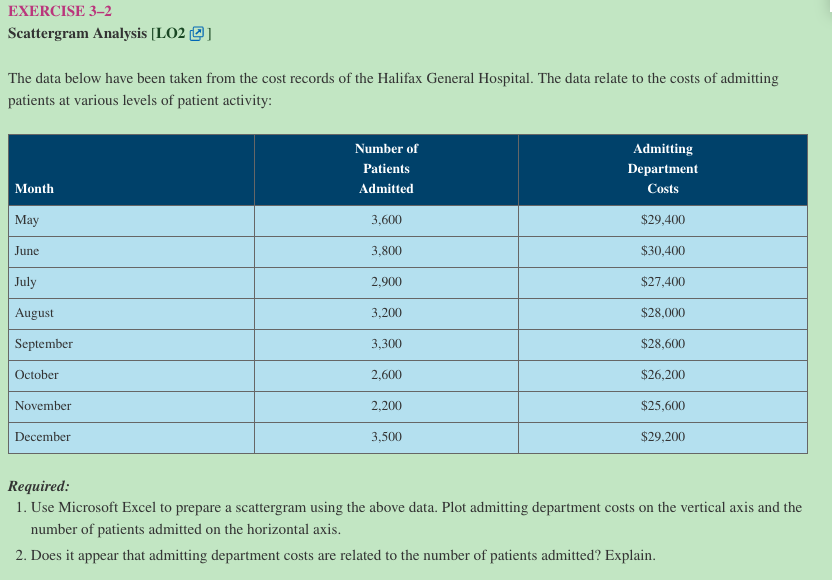
EXERCISE 3-2 Scattergram Analysis [LO2 Q1 The data below have been taken from the cost records of the Halifax General Hospital. The data relate to the costs of admitting patients at various levels of patient activity: Number of Patients Admitted Admitting Department Costs Month May 3,600 $29,400 $30,400 June 3,800 July 2,900 $27,400 August 3,200 $28,000 September 3,300 $28,600 October $26,200 2,600 2,200 November December $25,600 $29,200 3,500 Required: 1. Use Microsoft Excel to prepare a scattergram using the above data. Plot admitting department costs on the vertical axis and the number of patients admitted on the horizontal axis. 2. Does it appear that admitting department costs are related to the number of patients admitted? Explain
Step by Step Solution
There are 3 Steps involved in it

Get step-by-step solutions from verified subject matter experts