

Question: Exercise 3.2(5), Ex5.2(4,6,7,10) 0 Question 4 v B 0/1 pt '0 100 8 99 (D Details Suppose that f(:c,y) = at which {(59, y) l
Exercise 3.2(5), Ex5.2(4,6,7,10)
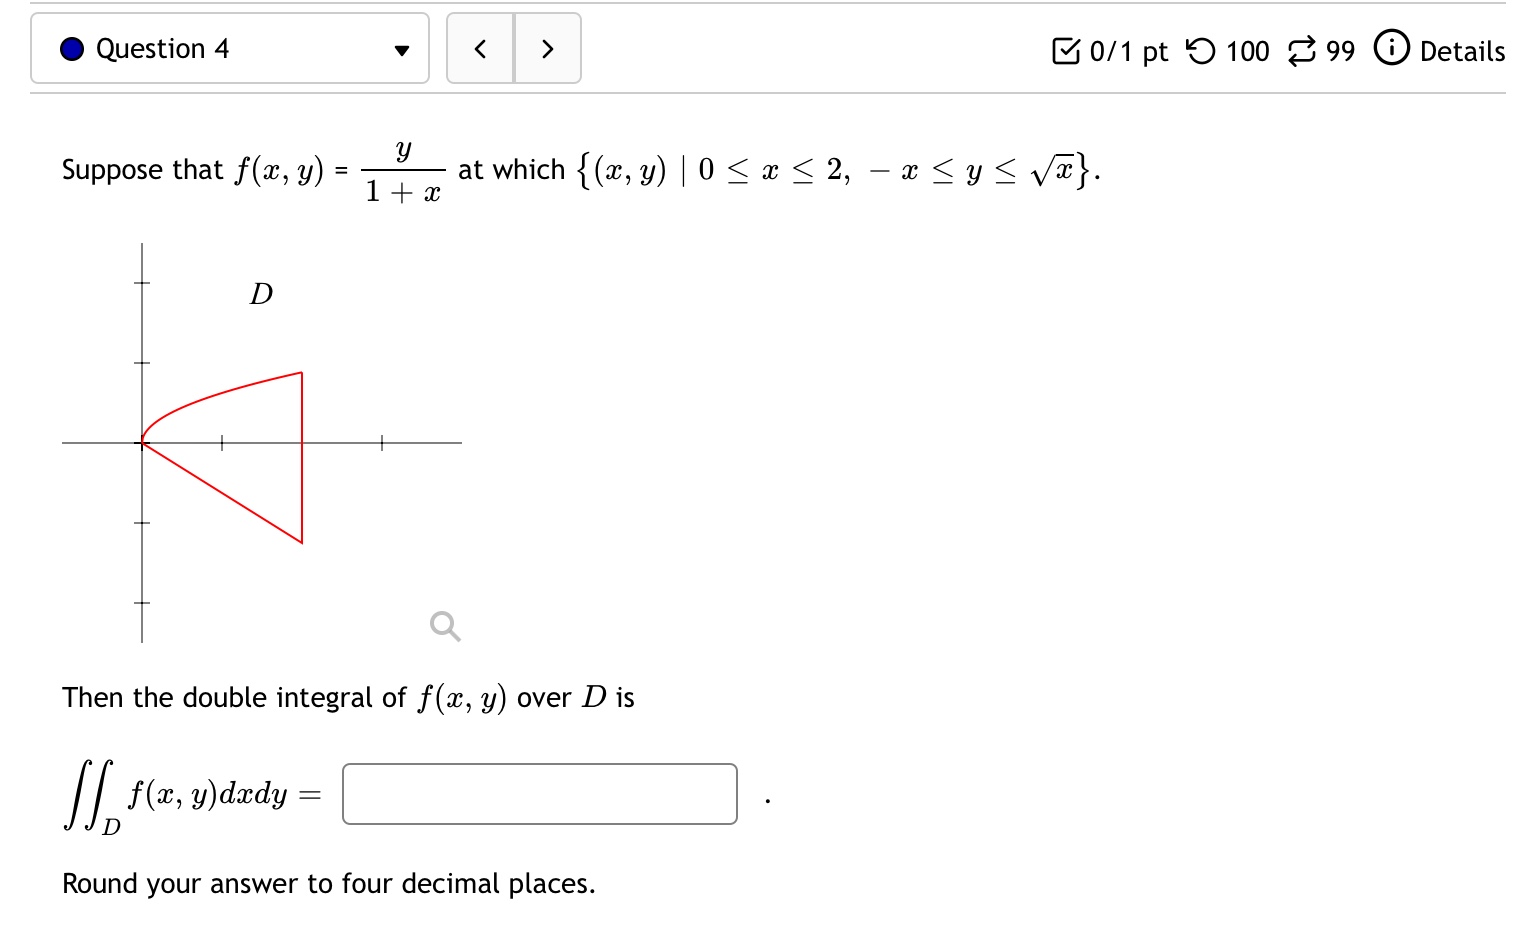
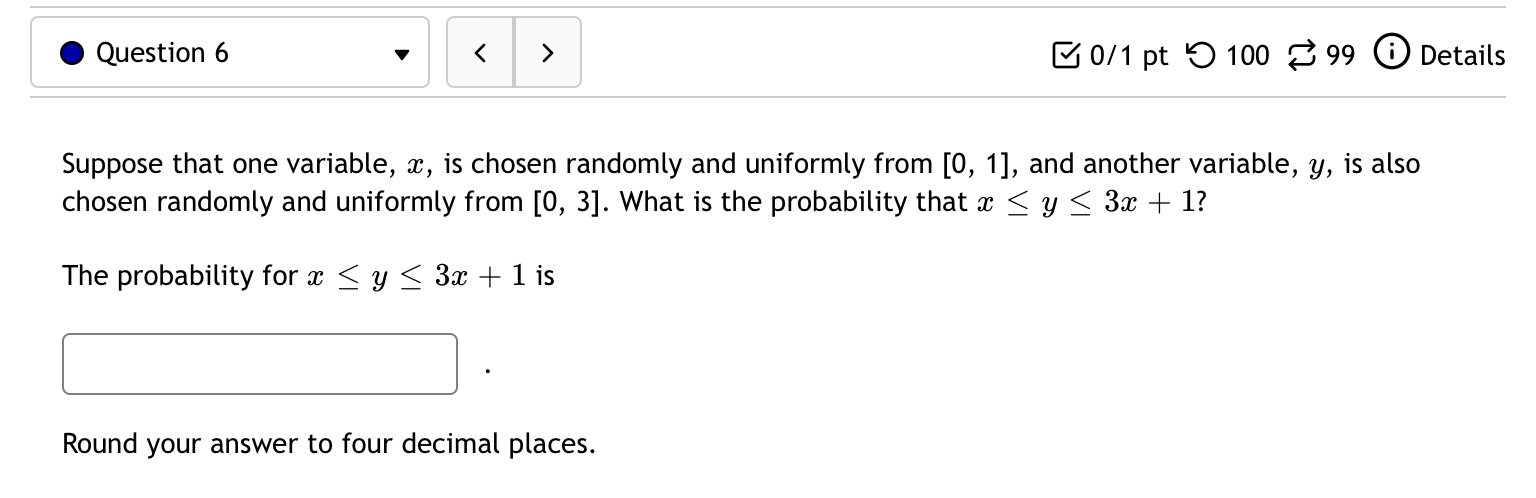
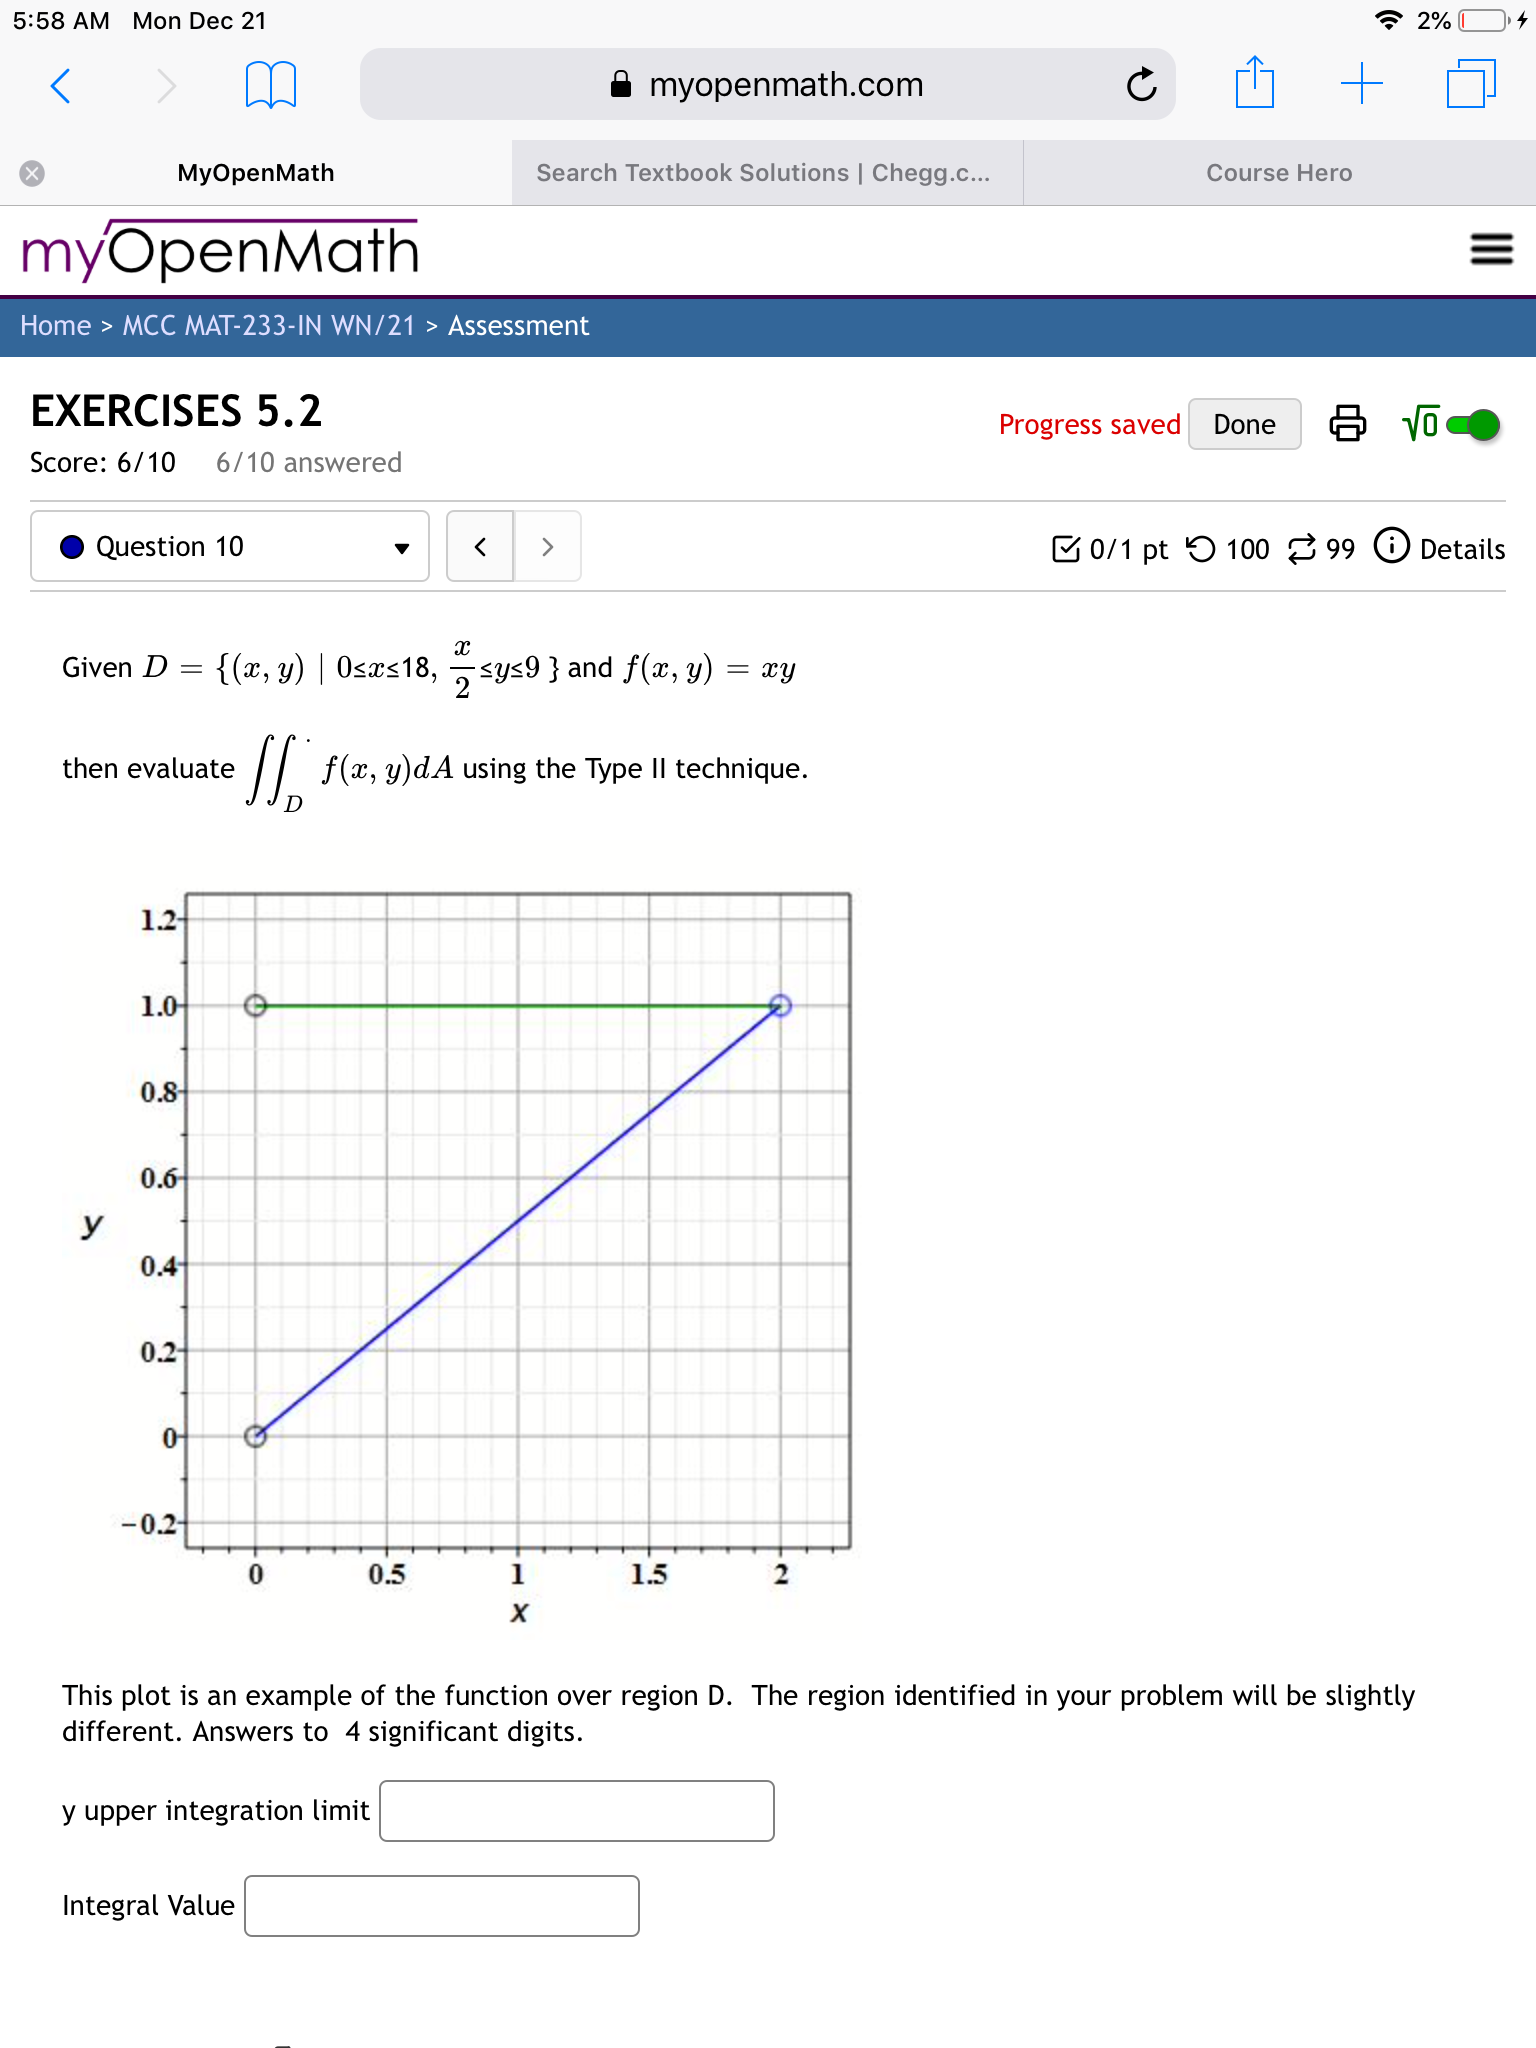
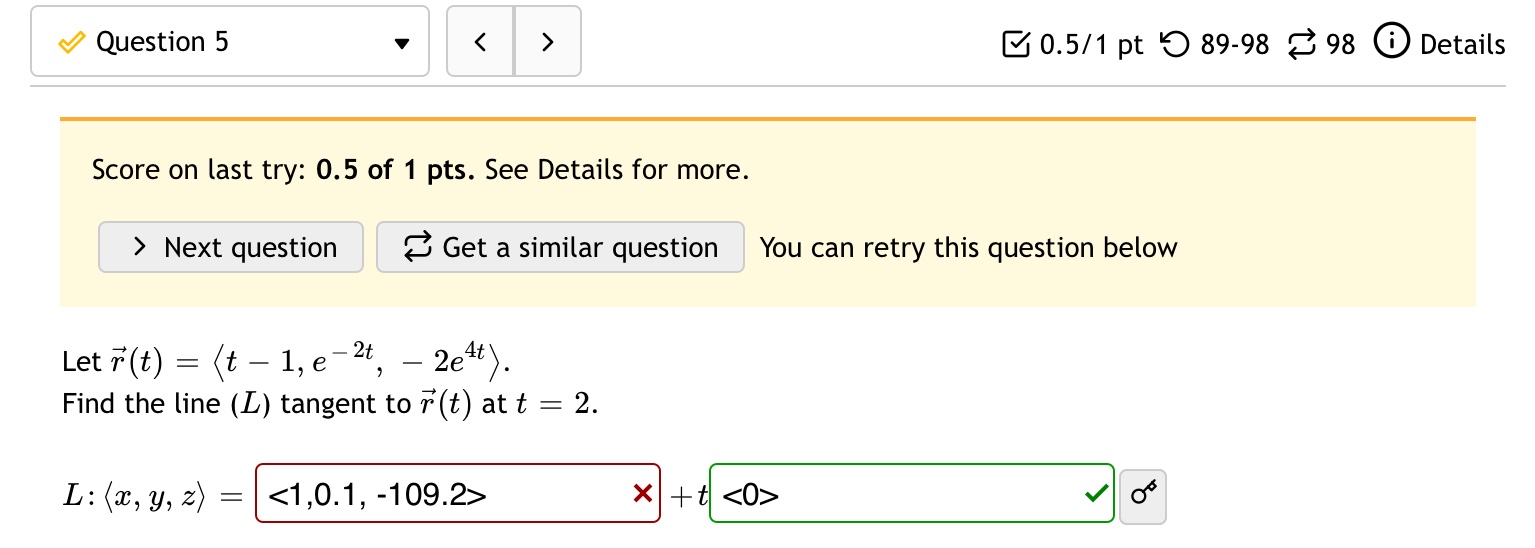
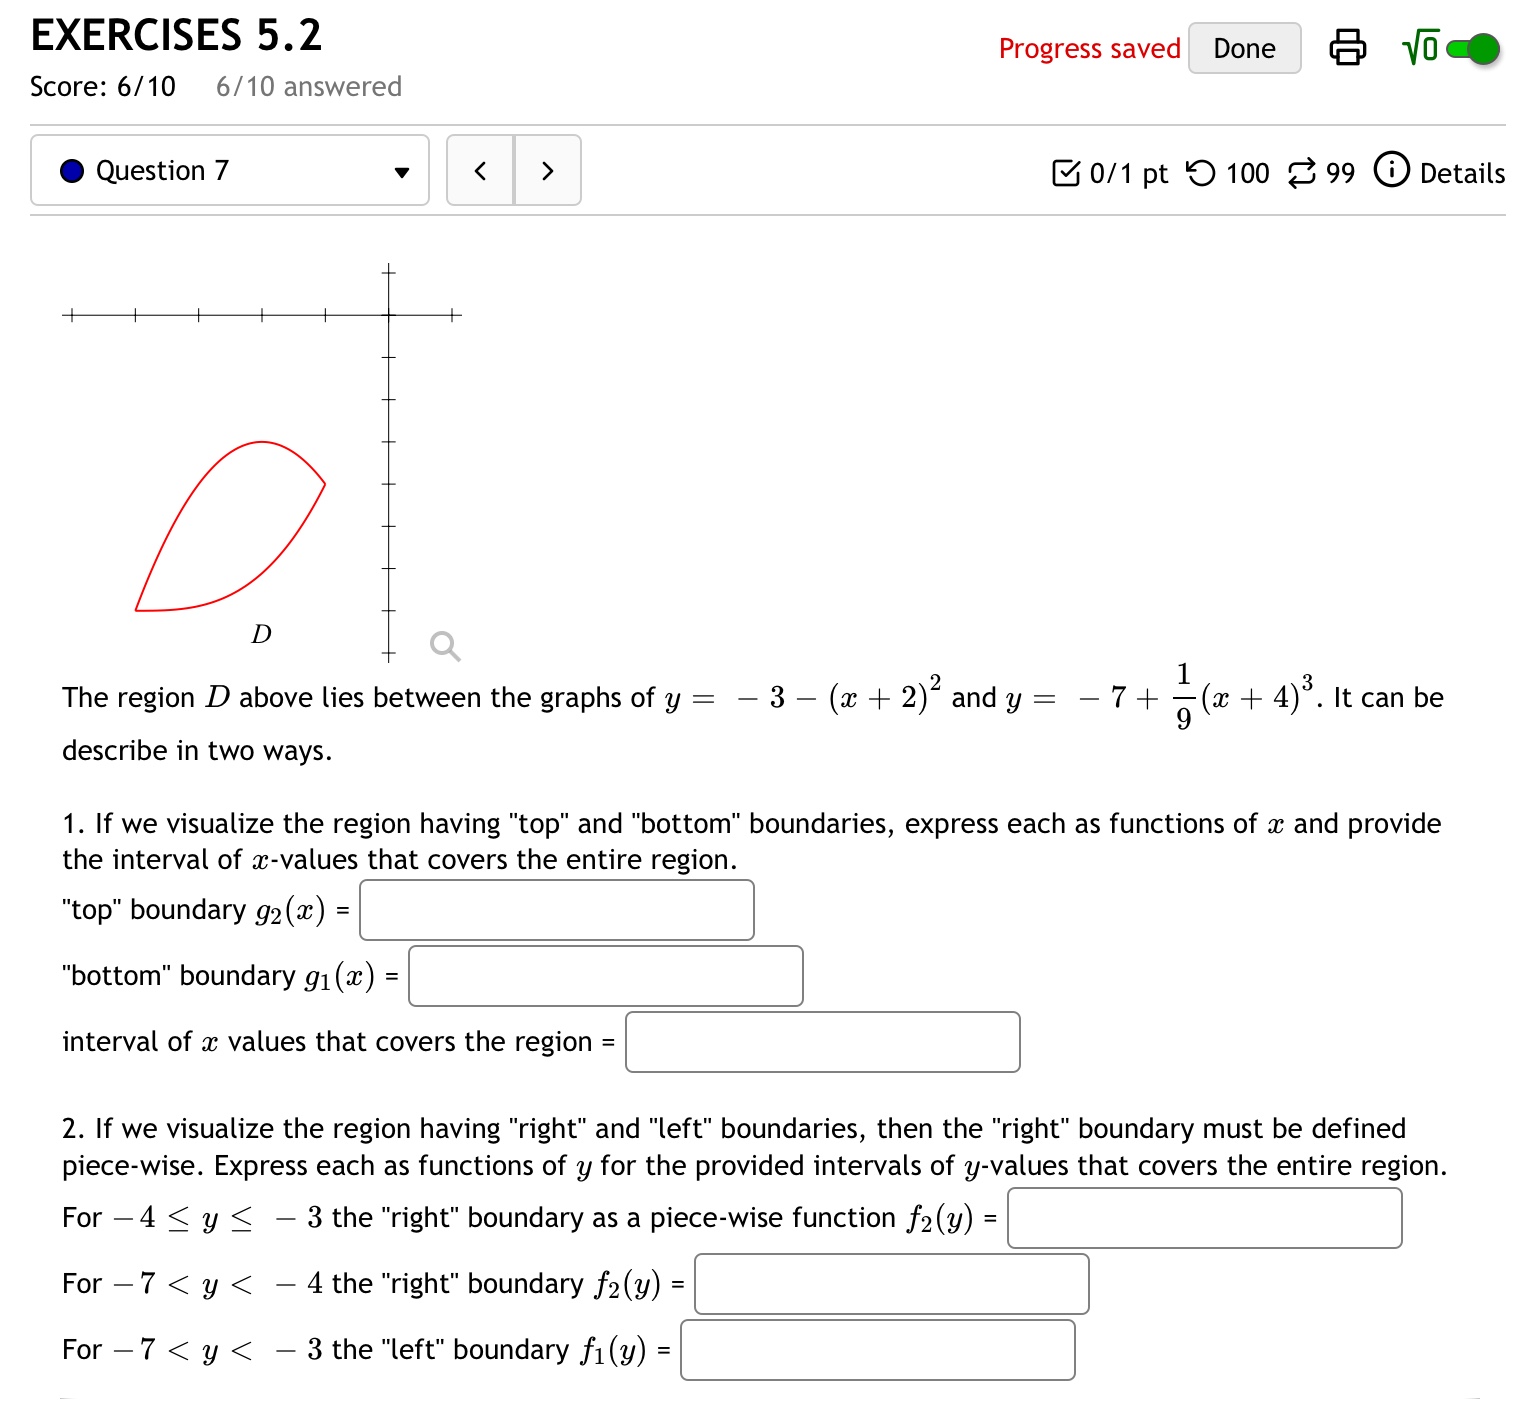
0 Question 4 v B 0/1 pt '0 100 8 99 (D Details Suppose that f(:c,y) = at which {(59, y) l 0 g a: S 2, a: g y 3 }. 1+3: Q Then the double integral of f(:v, 3;) over D is ffDdedF Round your answer to four decimal places. 0 Question 6 v E 0/1 pt '0 100 8 99 (D Details Suppose that one variable, 3:, is chosen randomly and uniformly from [0, 1], and another variable, y, is also chosen randomly and uniformly from [0, 3]. What is the probability that a: S y S 3n: + 1? The probability for a: g y 5 3:3 + 1 is Round your answer to four decimal places. 5:58 AM Mon Dec 21 2%4 DA myopenmath.com C + X MyOpenMath Search Textbook Solutions | Chegg.c... Course Hero myOpenMath Home > MCC MAT-233-IN WN/21 > Assessment EXERCISES 5.2 Progress saved Done & VO CO Score: 6/10 6/10 answered . Question 10 0/1 pt 9 100 99 0 Details Given D = {(x, y) | Osas18, ,, sys9 } and f(x, y) = xy then evaluate / / f(x, y)dA using the Type II technique. 1.2- 1.0- 0.8 0.6 y 0.4 0.2- -0.2 0.5 1.5 This plot is an example of the function over region D. The region identified in your problem will be slightly different. Answers to 4 significant digits. y upper integration limit Integral ValueJ Question 5 v E 0.5/1 pt '0 89-98 8 98 6) Details Score on last try: 0.5 of 1 pts. See Details for more. > Next question 8 Get a similar question You can retry this question below Let F05) = (t 1, e'zt, 26\"). Find the line (L) tangent to F(t) at t = 2. L:(ac,y,z) = x +1, [E] EXERCISES 5.2 Score: 6/10 6/10 answered Progress saved Done (3) {6' 0 Question 7 v B 0/1 pt '0 100 8 99 (D Details -lllllll- D _ T q 1 The region D above lies between the graphs of y = 3 (a: + 2)2 and y = 7 + 3(2: + 4)3. It can be describe in two ways. 1. If we visualize the region having "top" and "bottom" boundaries, express each as functions of an and provide the interval of m-values that covers the entire region. interval of a: values that covers the region = 2. If we visualize the region having "right" and "left" boundaries, then the "right" boundary must be defined piece-wise. Express each as functions of y for the provided intervals of y-values that covers the entire region. For 4 S y S 3 the "right" boundary as a piece-wise function f2(y) = For 7
Step by Step Solution
There are 3 Steps involved in it

Get step-by-step solutions from verified subject matter experts