

Question: Exercise 4 : ( Empirical Analysis of Performance and Algorithm Visualization ) [ CL 0 2 . 1 , S 1 , 1 Mark ]
Exercise : Empirical Analysis of Performance and Algorithm Visualization
CL S Mark
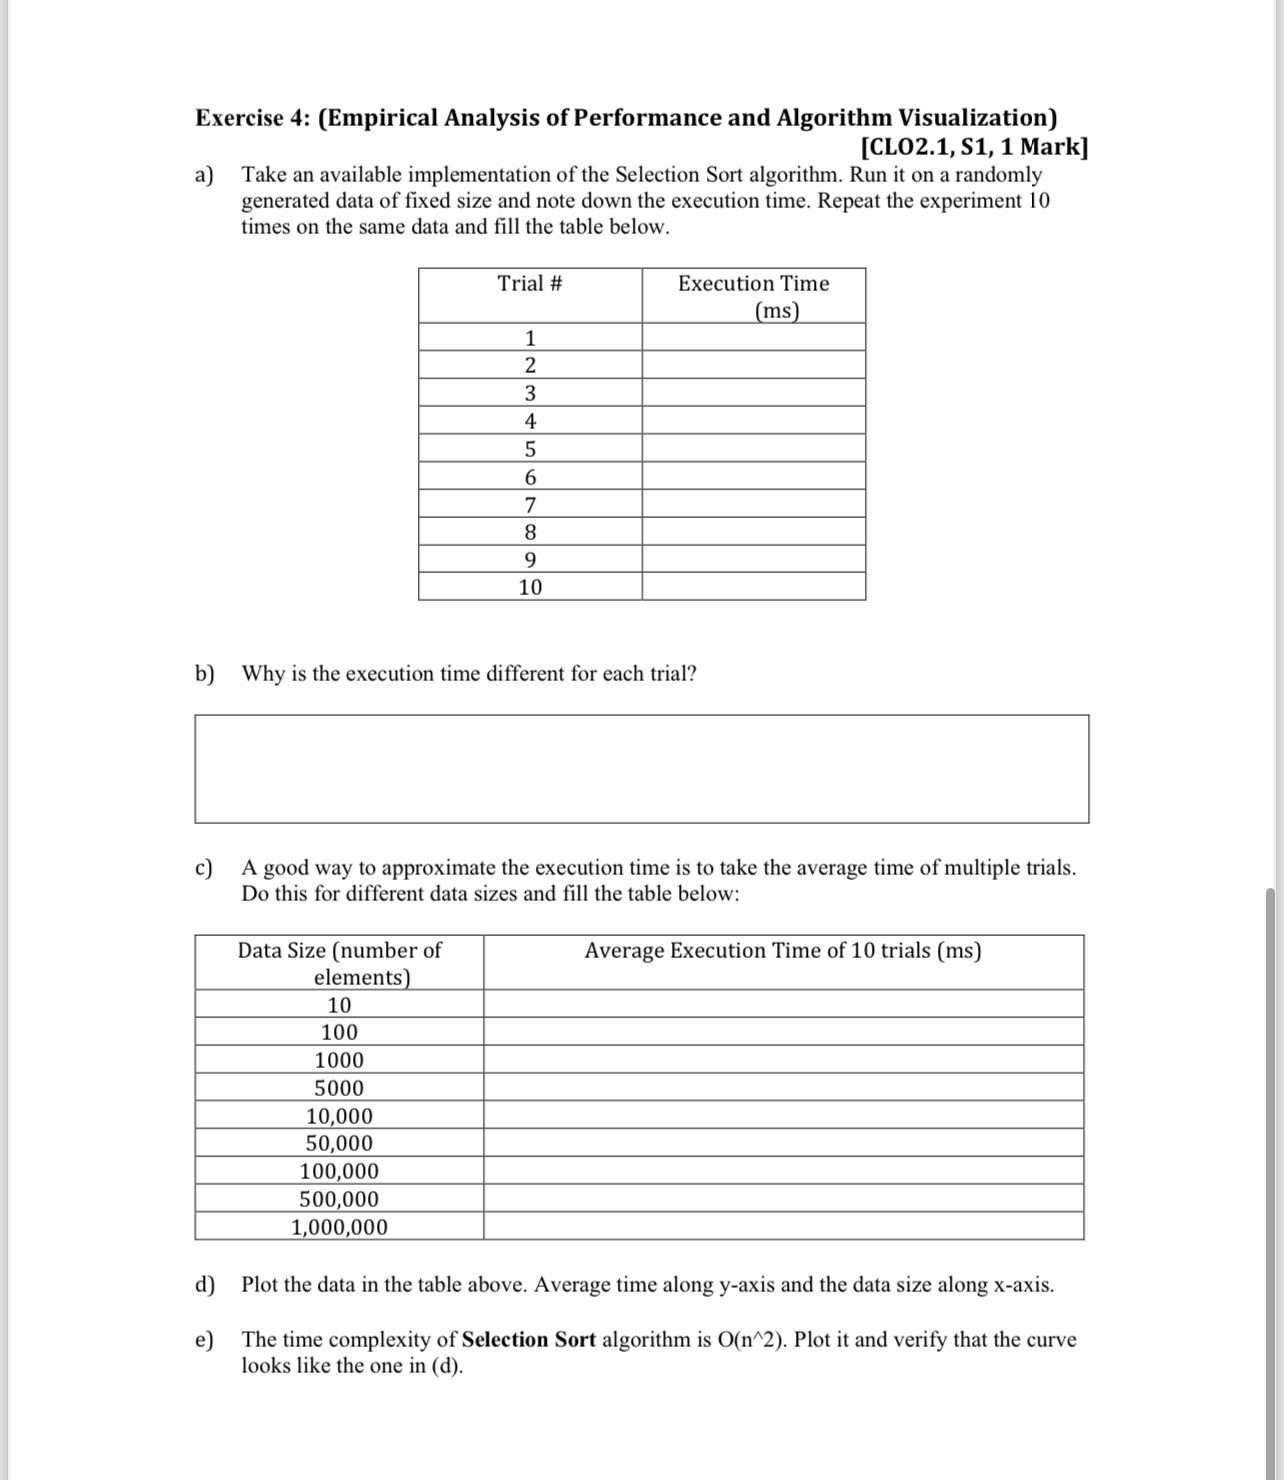
a Take an available implementation of the Selection Sort algorithm. Run it on a randomly generated data of fixed size and note down the execution time. Repeat the experiment times on the same data and fill the table below.
tableTrial #tableExecution Timems
b Why is the execution time different for each trial?
c A good way to approximate the execution time is to take the average time of multiple trials. Do this for different data sizes and fill the table below:
tabletableData Size number ofelementsAverage Execution Time of trials ms
d Plot the data in the table above. Average time along axis and the data size along axis.
e The time complexity of Selection Sort algorithm is Plot it and verify that the curve looks like the one in d
Step by Step Solution
There are 3 Steps involved in it
1 Expert Approved Answer
Step: 1 Unlock

Question Has Been Solved by an Expert!
Get step-by-step solutions from verified subject matter experts
Step: 2 Unlock
Step: 3 Unlock