

Question: Exercise 4-9 From the data below, construct (1) a break-even chart, and (2) a profit-volume graph similar to the ones in the text. Selling price
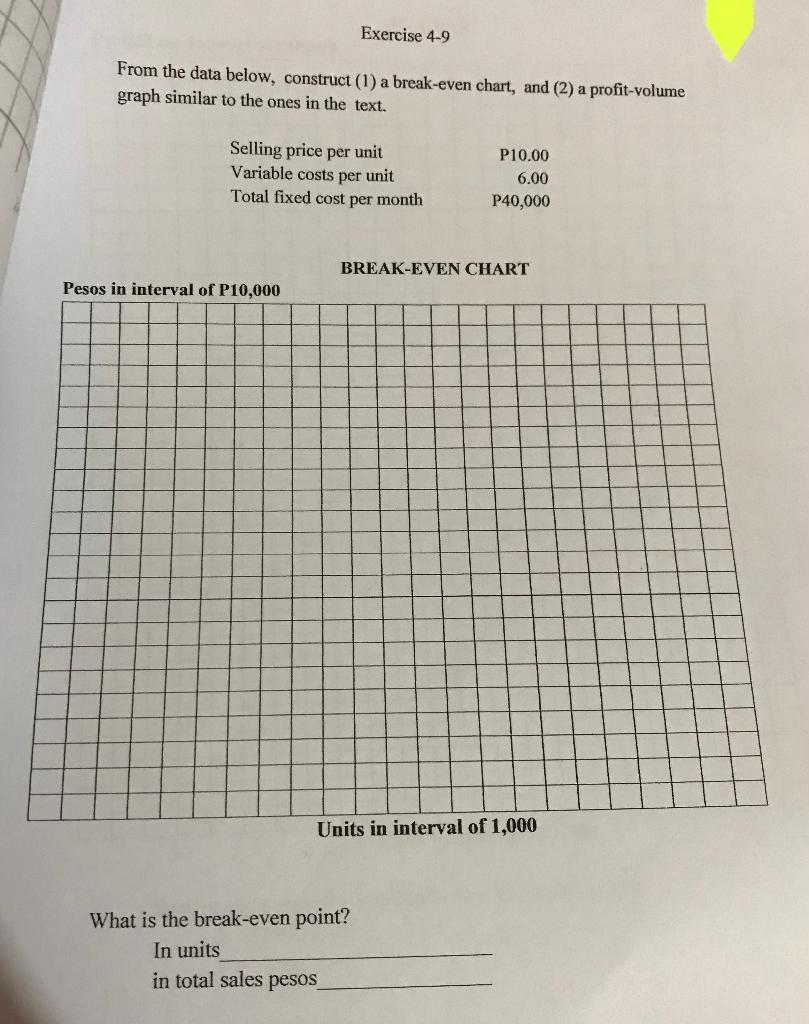
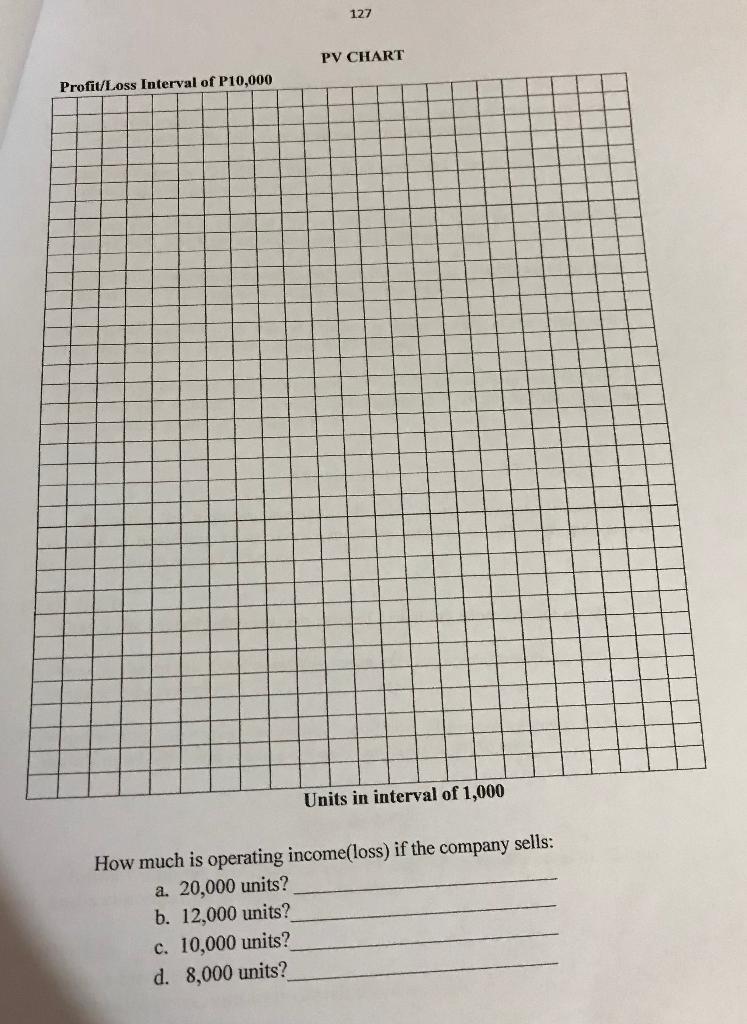
Exercise 4-9 From the data below, construct (1) a break-even chart, and (2) a profit-volume graph similar to the ones in the text. Selling price per unit Variable costs per unit Total fixed cost per month P10.00 6.00 P40,000 BREAK-EVEN CHART Pesos in interval of P10,000 Units in interval of 1,000 What is the break-even point? In units in total sales pesos 127 PV CHART Profit/Loss Interval of P10,000 Units in interval of 1,000 How much is operating income(loss) if the company sells: a. 20,000 units? b. 12,000 units? c. 10,000 units? d. 8,000 units
Step by Step Solution
There are 3 Steps involved in it
1 Expert Approved Answer
Step: 1 Unlock

Question Has Been Solved by an Expert!
Get step-by-step solutions from verified subject matter experts
Step: 2 Unlock
Step: 3 Unlock