

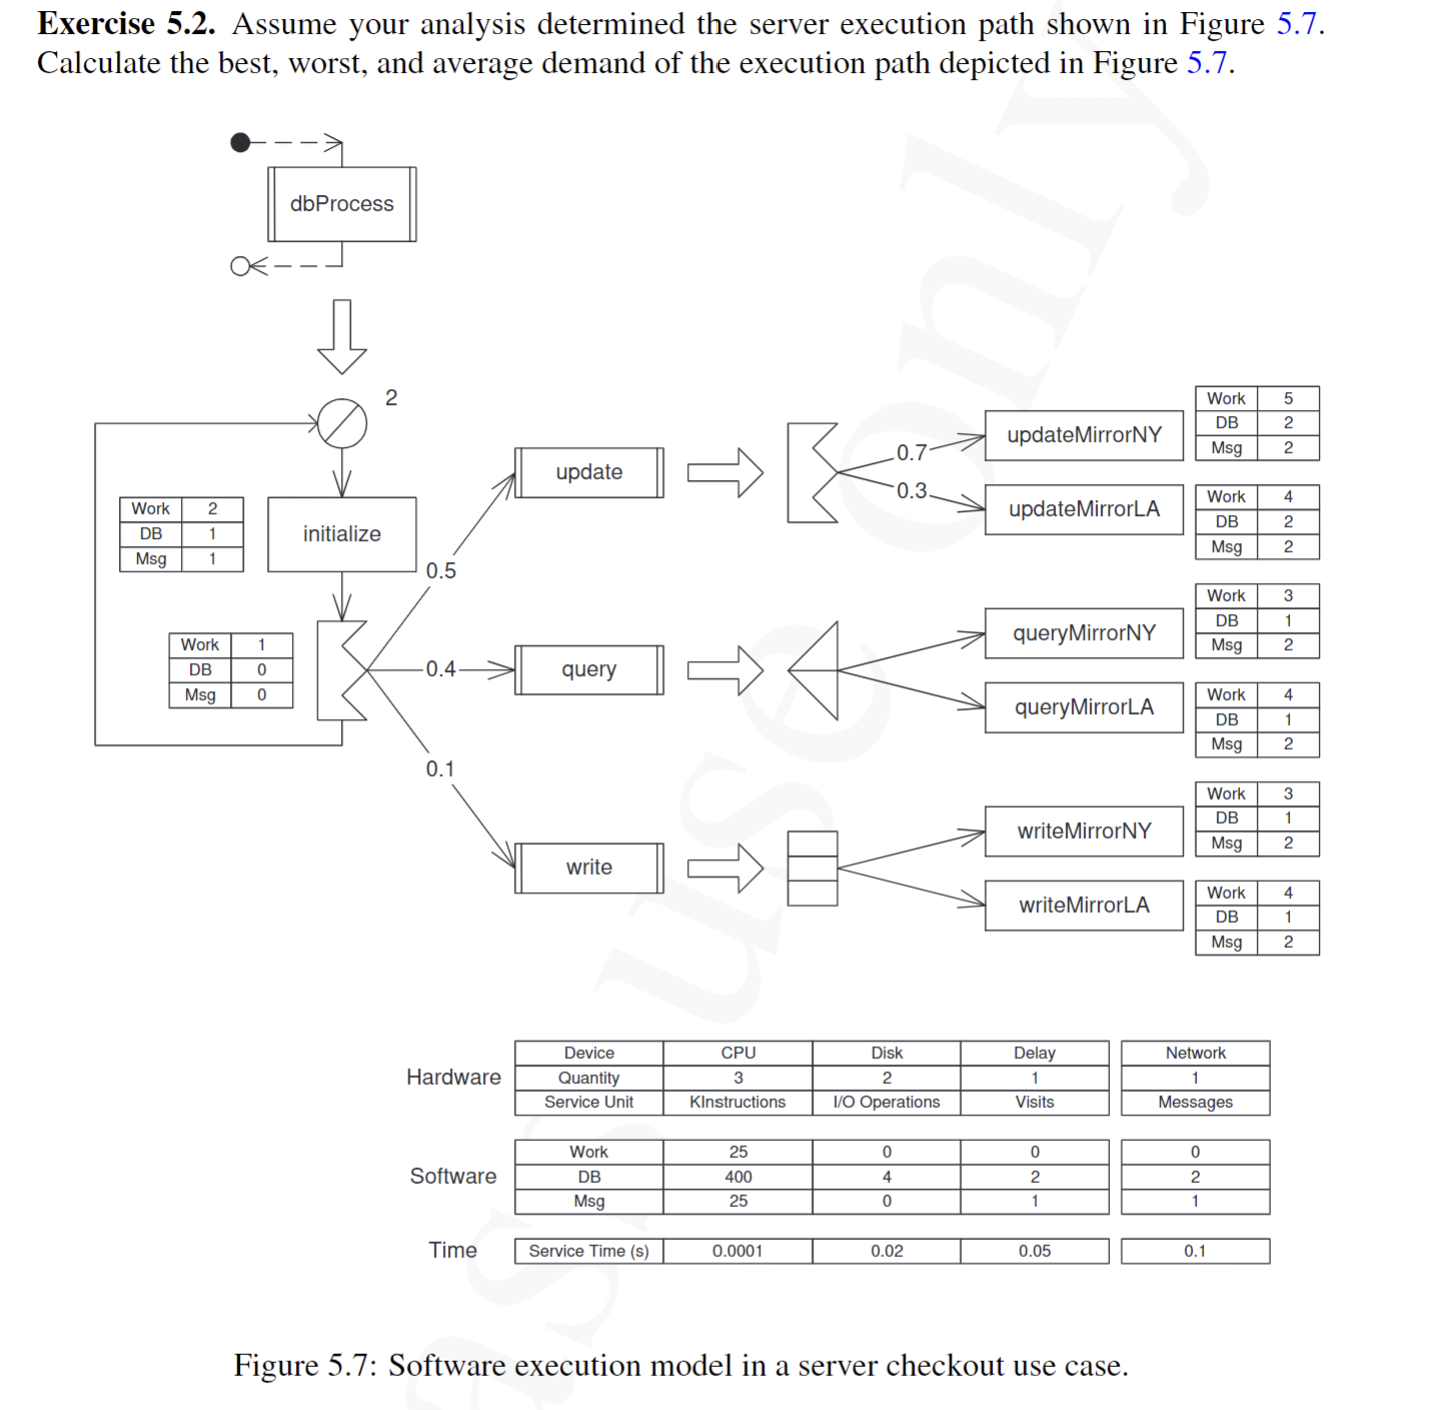
Question: Exercise 5 . 2 . Assume your analysis determined the server execution path shown in Figure 5 . 7 . Calculate the best, worst, and
Exercise Assume your analysis determined the server execution path shown in Figure Calculate the best, worst, and average demand of the execution path depicted in Figure
rightarrow
dbProcess
Time
Service Time s
Figure : Software execution model in a server checkout use case.
Step by Step Solution
There are 3 Steps involved in it
1 Expert Approved Answer
Step: 1 Unlock

Question Has Been Solved by an Expert!
Get step-by-step solutions from verified subject matter experts
Step: 2 Unlock
Step: 3 Unlock