

Question: Exercise #5 (Total : 30 Points) - See the following check sheet showing the most common problems (during the year 2019) in a restaurant for
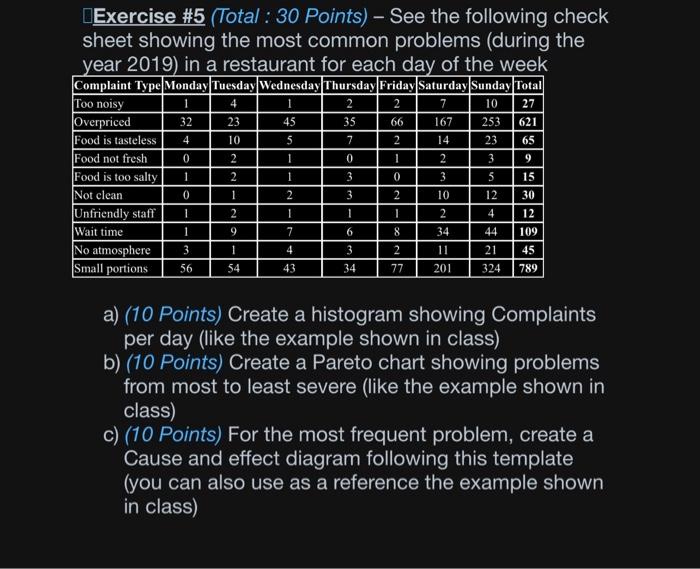
Exercise \#5 (Total : 30 Points) - See the following check sheet showing the most common problems (during the year 2019) in a restaurant for each day of the week a) (10 Points) Create a histogram showing Complaints per day (like the example shown in class) b) (10 Points) Create a Pareto chart showing problems from most to least severe (like the example shown in class) c) (10 Points) For the most frequent problem, create a Cause and effect diagram following this template (you can also use as a reference the example shown in class)
Step by Step Solution
There are 3 Steps involved in it
1 Expert Approved Answer
Step: 1 Unlock

Question Has Been Solved by an Expert!
Get step-by-step solutions from verified subject matter experts
Step: 2 Unlock
Step: 3 Unlock