

Question: EXERCISE 5A-4 High-Low Method; Scattergraph Analysis L05-10 Archer Company is a wholesaler of custom-built air-conditioning units for commercial buildings It gathered the following monthly data
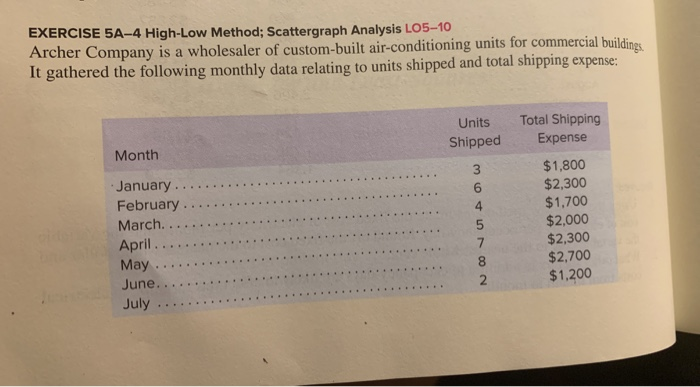
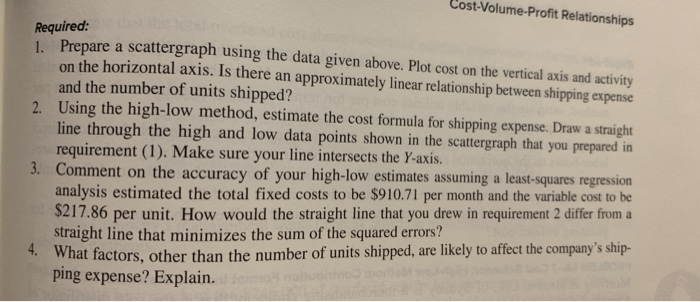
EXERCISE 5A-4 High-Low Method; Scattergraph Analysis L05-10 Archer Company is a wholesaler of custom-built air-conditioning units for commercial buildings It gathered the following monthly data relating to units shipped and total shipping expense: Units Shipped Month January February... March. ....... April May ...... June...... July ........ Now Total Shipping Expense $1,800 $2,300 $1,700 $2,000 $2,300 $2,700 $1,200 Cost-Volume-Profit Relationships Required: 1 Prepare a scattergraph using the data given above. Plot cost on the vertical axis and activity on the horizontal axis. Is there an approximately linear relationship between shipping expense and the number of units shipped? 2. Using the high-low method, estimate the cost formula for shipping expense. Draw a straight line through the high and low data points shown in the scattergraph that you prepared in requirement (1). Make sure your line intersects the Y-axis. 3. Comment on the accuracy of your high-low estimates assuming a least-squares regression analysis estimated the total fixed costs to be $910.71 per month and the variable cost to be $217.86 per unit. How would the straight line that you drew in requirement 2 differ from a straight line that minimizes the sum of the squared errors? What factors, other than the number of units shipped, are likely to affect the company's ship- ping expense? Explain. EXERCISE 5A-4 High-Low Method; Scattergraph Analysis L05-10 Archer Company is a wholesaler of custom-built air-conditioning units for commercial buildings It gathered the following monthly data relating to units shipped and total shipping expense: Units Shipped Month January February... March. ....... April May ...... June...... July ........ Now Total Shipping Expense $1,800 $2,300 $1,700 $2,000 $2,300 $2,700 $1,200 Cost-Volume-Profit Relationships Required: 1 Prepare a scattergraph using the data given above. Plot cost on the vertical axis and activity on the horizontal axis. Is there an approximately linear relationship between shipping expense and the number of units shipped? 2. Using the high-low method, estimate the cost formula for shipping expense. Draw a straight line through the high and low data points shown in the scattergraph that you prepared in requirement (1). Make sure your line intersects the Y-axis. 3. Comment on the accuracy of your high-low estimates assuming a least-squares regression analysis estimated the total fixed costs to be $910.71 per month and the variable cost to be $217.86 per unit. How would the straight line that you drew in requirement 2 differ from a straight line that minimizes the sum of the squared errors? What factors, other than the number of units shipped, are likely to affect the company's ship- ping expense? Explain
Step by Step Solution
There are 3 Steps involved in it

Get step-by-step solutions from verified subject matter experts