

Question: Exercise 6 Plot . f[$,y) : :2 + 1,12 over the domain 1 > [X1 Y1] = meshgrid(0:0. 5:5); >> [32 Y2] = meshgrid(0:5, 1:6);
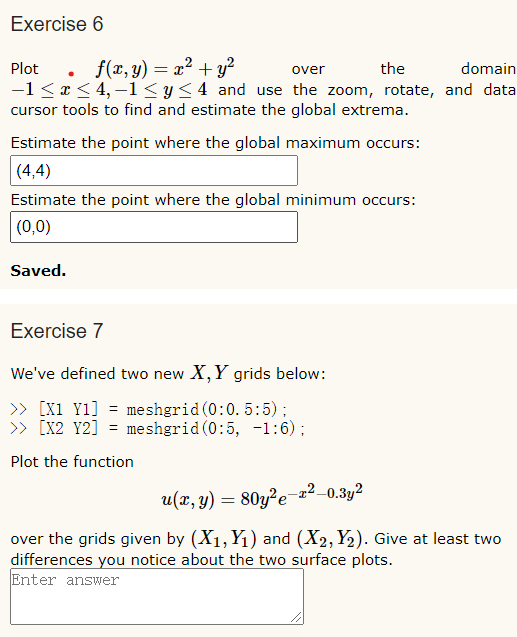
Exercise 6 Plot . f[$,y) : :2 + 1,12 over the domain 1 <_1 :1: y and use the zoom rotate data cursor tools to find estimate global extrema. point where maximum occurs: l minimum saved. exercise we defined two new x grids below:>> [X1 Y1] = meshgrid(0:0. 5:5); >> [32 Y2] = meshgrid(0:5, 1:6); Plot the function 2 2 \"[31 y) = 80y2Ez Il].3y over the grids given by [X1,Yi) and [X2,Y2}. Give at least two differences ou notice about the two surface plots. Enter
Step by Step Solution
There are 3 Steps involved in it
1 Expert Approved Answer
Step: 1 Unlock

Question Has Been Solved by an Expert!
Get step-by-step solutions from verified subject matter experts
Step: 2 Unlock
Step: 3 Unlock