

Question: Exercise 6* (Statistical Testing) After the exam, the exam results are published together with some basic statistical information, including the number of participants up =
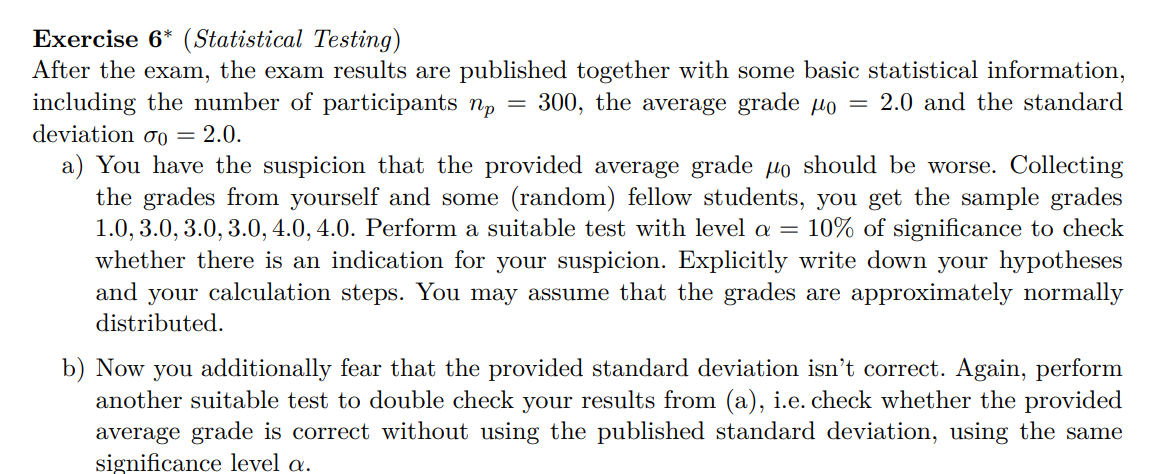

Exercise 6* (Statistical Testing) After the exam, the exam results are published together with some basic statistical information, including the number of participants up = 300, the average grade #0 = 2.0 and the standard deviation 0'0 = 2.0. a) You have the suSpicion that the provided average grade #0 should be worse. Collecting the grades from yourself and some (random) fellow students, you get the sample grades 1.0, 3.0,3.0, 3.0, 4.0,40. Perform a suitable test with level a = 10% of signicance to check whether there is an indication for your suspicion. Explicitly write down your hypotheses and your calculation steps. You may assume that the grades are approximately normally distributed. b) Now you additionally fear that the provided standard deviation isn't correct. Again, perform another suitable test to double check your results from (a), i.e. check whether the provided average grade is correct without using the published standard deviation, using the same signicance level a
Step by Step Solution
There are 3 Steps involved in it

Get step-by-step solutions from verified subject matter experts