

Question: EXERCISE 8: CREATING CLUSTERED BAR CHART For this exercise you will analyze the changes in yearly revenue for five different companies in the retail industry.
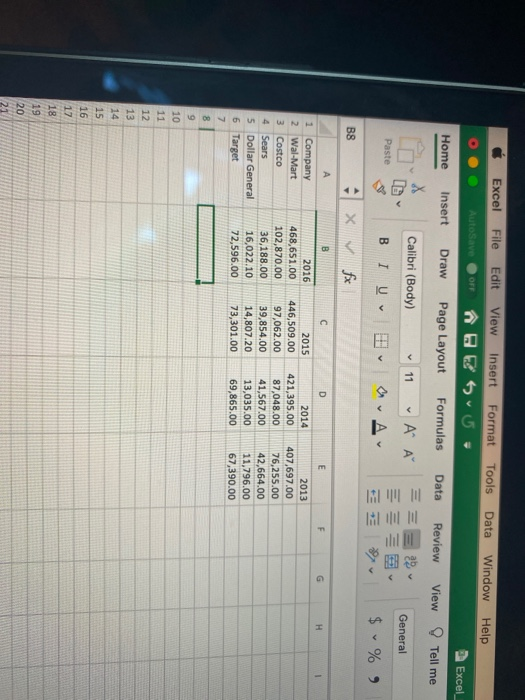
EXERCISE 8: CREATING CLUSTERED BAR CHART For this exercise you will analyze the changes in yearly revenue for five different companies in the retail industry. The data is provided for you. Go to the "Excel_Homework and click on tab/worksheet labeled "Bar Chart." The columns are years and the rows are companies. The data is the yearly revenue in millions of dollars. I Create a Clustered Bar Chart Use the results to answer the following questions: 1. Which company had the smallest revenue in 2015? 2. Approximate Wal-Mart's 2013 revenue. 3. Which company experienced a decline in revenue from 2013 to 2014? 4. Which year did Costco have the highest revenue? Type All Answers on your Excel Spreadsheet that you will submit. Excel File Edit View Insert Format Tools Data Window Help Lors Excel Home Insert Draw Page Layout Formulas Data Review View Tell me Calibri (Body) 11 AM 29 a. Av General Paste BIU $ % ) B8 B D E F G 2016 468,651.00 102,870.00 36,188.00 16,022.10 72,596.00 2015 446,509.00 97,062.00 39,854.00 14,807.20 73,301.00 2014 421,395.00 87,048.00 41,567.00 13,035.00 69,865.00 2013 407,697.00 76,255.00 42,664.00 11,796.00 67,390.00 1 Company 2 Wal-Mart 3 Costco 4 Sears 5 Dollar General 6 Target 7 8 9 10 11 12 13 14 15 16 17 18 19 20 21
Step by Step Solution
There are 3 Steps involved in it

Get step-by-step solutions from verified subject matter experts